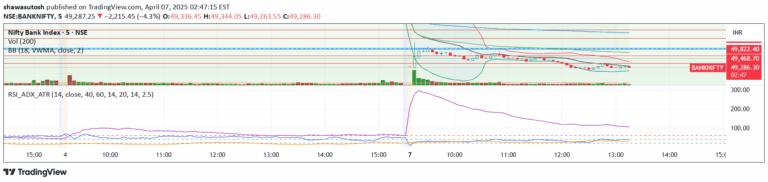
Multi-timeframe Bollinger BandWidth Indicator that analyzes market volatility and trend strength across different timeframes, helping traders make informed trading decisions.
Explore complementary indicator rolesHow it works
The MTF Bollinger BandWidth Indicator calculates the percentage difference between upper and lower Bollinger Bands to measure market volatility. It tracks how these bands expand and contract, providing insights into price movement dynamics across multiple timeframes.
The indicator automatically identifies high and low pivot points, creating a comprehensive view of market behavior. By analyzing these pivots and bandwidths, traders can detect potential trend changes, volatility shifts, and critical market transition points with greater precision.
Why it may be useful
This indicator is crucial because it provides traders with a nuanced understanding of market volatility beyond single-timeframe analysis. By offering a multi-dimensional perspective, it helps traders recognize potential breakout scenarios, assess trend strength, and make more informed trading decisions.
The dynamic color-coding and customizable parameters allow traders to adapt the tool to their specific trading style and market conditions. Its ability to track volatility across different timeframes makes it a powerful tool for understanding complex market movements and potential trading opportunities.
When to explore it
The MTF Bollinger BandWidth Indicator is most effective during periods of market transition, such as when volatility is changing or potential breakouts are emerging. Traders can use it to identify squeeze and expansion phases, which often precede significant price movements.
It is particularly useful in markets with varying volatility levels, including forex, stocks, and cryptocurrencies. Traders should pay special attention to the indicator during economic announcements, trend reversals, and when comparing volatility across different timeframes to gain comprehensive market insights.
Keep exploring
What we’ve verified
Access, alerts and repainting behaviour have not been independently verified for this indicator. Check the creator’s current publication and settings.
General descriptions and classifications are recovered research. Verified details above identify the specific checks we have completed. Check the creator’s current publication for later changes.