Bjorgum Double Tap
Double Tap is a pattern recognition strategy that identifies double top and double bottom formations, providing entry signals based on price action reversals and breakout patterns.
Explore 11,183 indicators. Filter beyond the obvious.
Discover the tools that fit the way you trade.
11,183 tools to explore
Double Tap is a pattern recognition strategy that identifies double top and double bottom formations, providing entry signals based on price action reversals and breakout patterns.
A multi-indicator trading tool that uses Ehlers' bandpass filter and Voss predictor to anticipate potential cyclic turning points in market price movements.
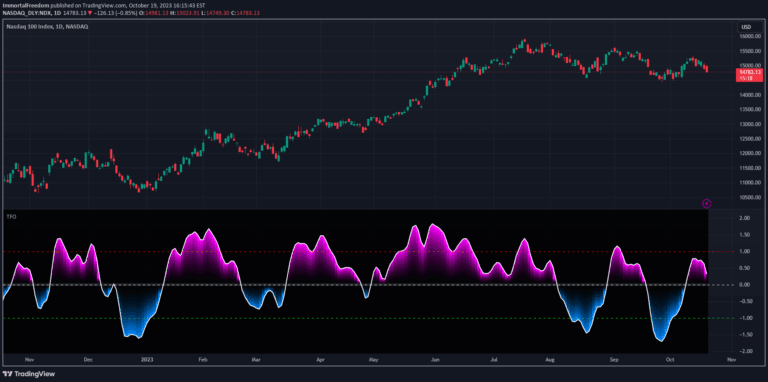
Trending RSI enhances traditional RSI by introducing trend information, breaking free from 0-100 range and providing more nuanced market insights through a centered oscillator.
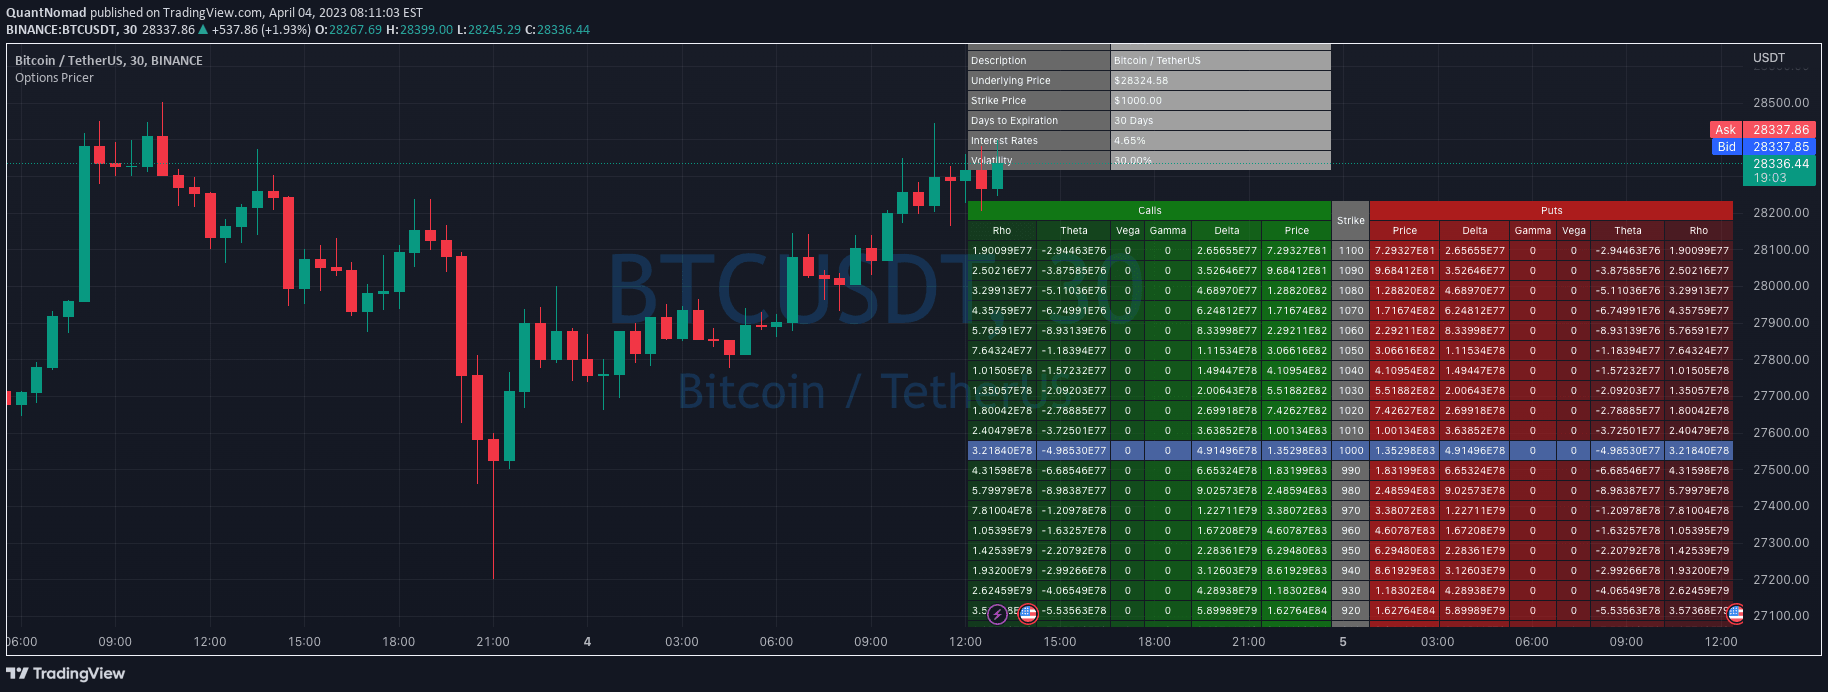
A TradingView option pricing tool that computes option prices and greeks for both put and call options using strikes, implied volatility, and days to expiry.
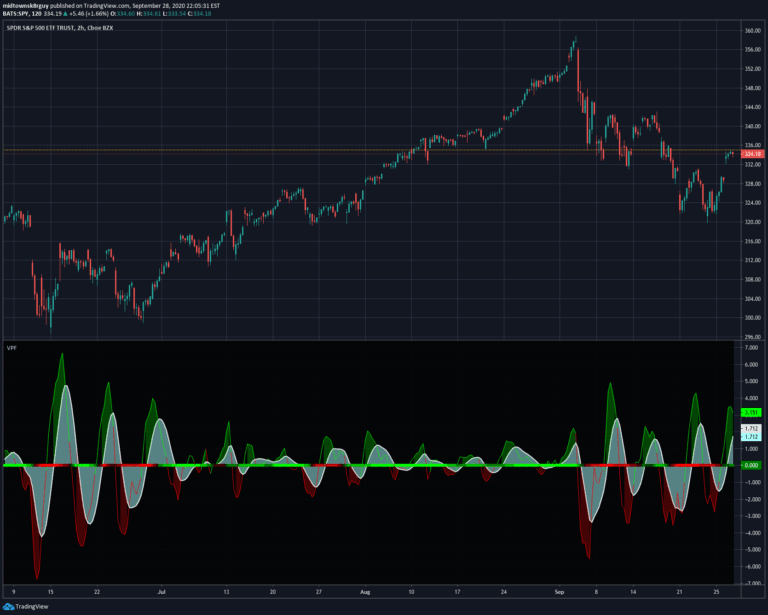
A volume-based indicator that identifies potential price reversals by analyzing volume trends, divergences, spikes, and contractions to help traders detect market shifts.
A comprehensive options pricing and risk analysis tool using the Black-Scholes model, providing theoretical option prices, Greeks, and implied volatility for accurate options trading insights.
A novel trend oscillator developed by Dr. John Ehlers that provides near zero-lag averaging with consistent performance across multiple timeframes and candle durations.
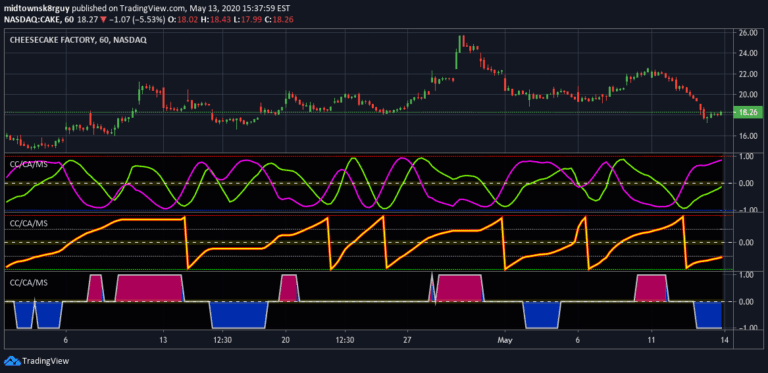
A multi-component trading indicator developed by Dr. John Ehlers that combines correlation cycle, correlation angle, and market state analysis to provide comprehensive market trend insights.
An improved McGinley Dynamic indicator that addresses computational limitations by implementing constraints to prevent extreme calculations and provide more stable trend analysis.
A TradingView script that identifies volume spikes, price up moves, and gap-up days to help traders recognize potential market trends and trading opportunities.
A novel Relative Strength indicator that compares an asset's performance against market indices like S&P 500, Dow Jones, and NASDAQ to provide comparative market insights.
A comprehensive funding rate indicator analyzing cryptocurrency markets across multiple exchanges, tracking price dynamics in perpetual futures and spot markets to reveal market sentiment.
Likes, views, and comments are historical TradingView snapshots. They describe attention, not trading performance.