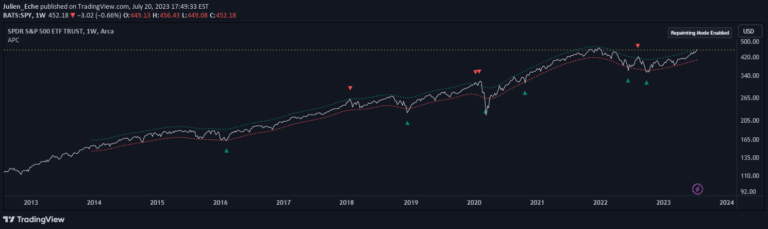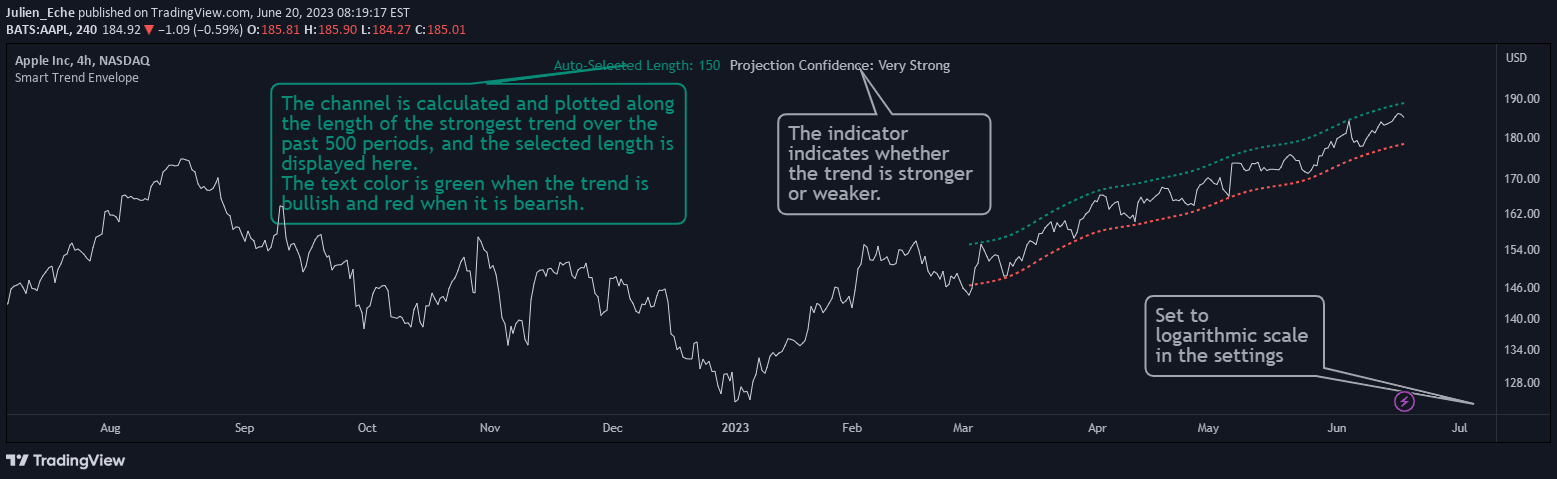
A dynamic trading indicator that combines trendline analysis and price smoothing to identify market trends with automatic length selection and projection confidence levels.
Explore complementary indicator rolesHow it works
The Smart Trend Envelope uses two advanced techniques to analyze market trends: the Strongest Trendline and Nadaraya-Watson Envelope. The Strongest Trendline calculates multiple trendline variations using logarithmic price transformations, assessing their slope, correlation coefficient, and statistical reliability. It automatically selects the most statistically robust trendline based on the highest Pearson's R correlation coefficient.
The Nadaraya-Watson Envelope complements this by applying kernel regression to smooth price data and generate upper and lower envelope lines. By adjusting bandwidth and multiplier parameters, the indicator creates a dynamic visualization of potential price movements, with color-coded representations indicating trend direction and strength.
Why it may be useful
The Smart Trend Envelope provides traders with a sophisticated, multi-dimensional view of market trends that goes beyond simple linear analysis. By dynamically selecting the most statistically reliable trendline, it offers more nuanced insights into potential price movements, helping traders make more informed decisions based on robust mathematical modeling.
The indicator's unique approach of combining trendline analysis with kernel regression allows for a more comprehensive understanding of market dynamics. Its projection confidence levels, ranging from Ultra Weak to Ultra Strong, give traders a quantitative measure of trend reliability, enabling more strategic entry and exit points in various market conditions.
When to explore it
The Smart Trend Envelope is most effective in markets with clear directional movements, particularly in higher timeframes where logarithmic scaling can better represent exponential price changes. It performs best in trending markets where price shows consistent directional movement, such as in cryptocurrencies, forex, and certain stock indices that exhibit strong momentum characteristics.
Traders should ideally use this indicator in conjunction with other technical analysis tools to confirm signals and validate potential trade setups. It is particularly useful for swing traders and day traders looking to identify trend strength and potential reversal points, with the caveat that the indicator may repaint, meaning historical results can change retrospectively.
Keep exploring
What we’ve verified
Access, alerts and repainting behaviour have not been independently verified for this indicator. Check the creator’s current publication and settings.
General descriptions and classifications are recovered research. Verified details above identify the specific checks we have completed. Check the creator’s current publication for later changes.