Dynamic Momentum Gauge
A momentum indicator that identifies potential trend shifts and market movement dynamics by calculating and analyzing momentum values without directional bias.
Explore 11,183 indicators. Filter beyond the obvious.
Discover the tools that fit the way you trade.
11,183 tools to explore
A momentum indicator that identifies potential trend shifts and market movement dynamics by calculating and analyzing momentum values without directional bias.
A sophisticated moving average technique using Gaussian kernel smoothing to reduce price noise and capture underlying market trends with dynamic bandwidth adaptation.
Fibonacci Extension is a technical analysis tool that predicts potential market support and resistance levels by extending Fibonacci ratios from price swing points.
A Bayesian statistical method for estimating market return probabilities by calculating directional bias through prior knowledge and observed data.
A volatility indicator using power variation to measure market price fluctuations and analyze the degree of price movement variation across different time periods.
A statistical test that determines whether a time series is stationary or non-stationary, helping traders understand if a financial instrument tends to mean-revert or follow a trend.
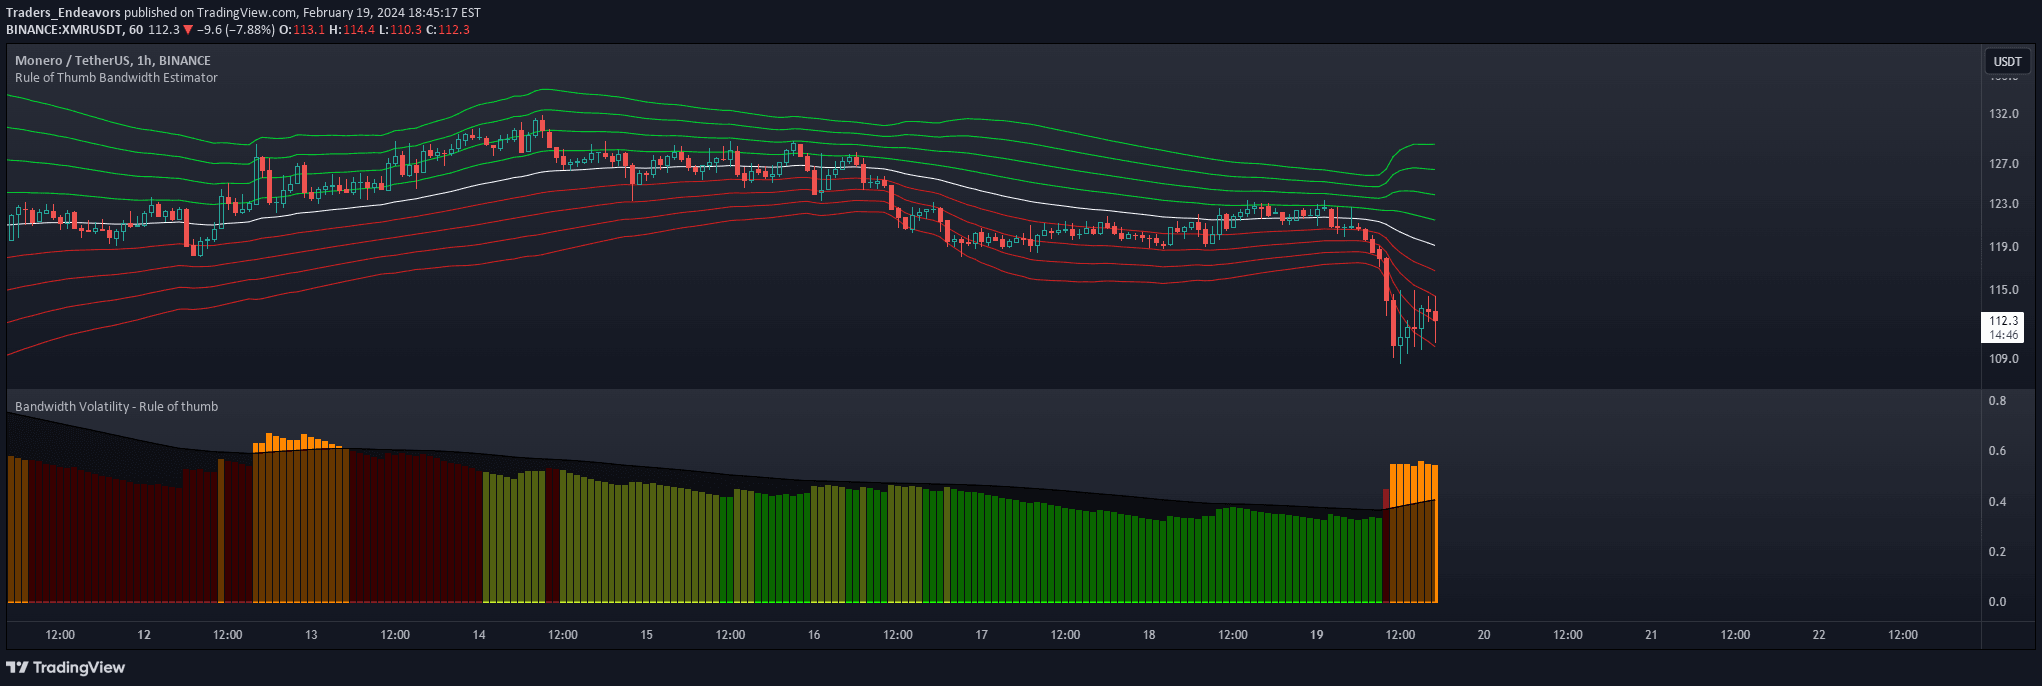
A volatility indicator using rule of thumb bandwidth estimator to measure market fluctuations by analyzing returns and standard deviations with color-coded visualization.
Bandwidth Bands use Silverman's Rule of Thumb to create dynamic volatility bands around a moving average, offering insights into price distribution and market volatility.
Likes, views, and comments are historical TradingView snapshots. They describe attention, not trading performance.