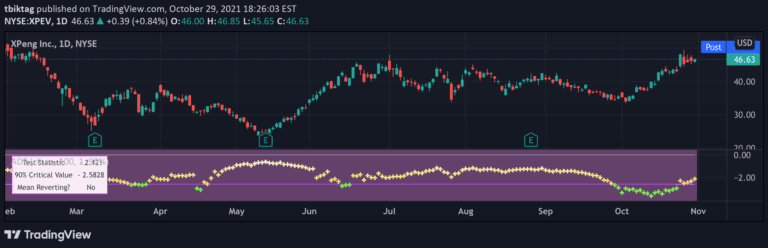
A statistical test that determines whether a time series is stationary or non-stationary, helping traders understand if a financial instrument tends to mean-revert or follow a trend.
Explore complementary indicator rolesHow it works
The Dickey-Fuller Test checks if a time series has a consistent statistical property over time by examining the relationship between the current value and its previous value. It calculates a test statistic and compares it against critical values at different significance levels to determine stationarity.
The test can be applied to raw prices, simple returns, or log returns, with each providing different insights into the time series' behavior. Raw prices typically show non-stationarity, while returns are more likely to exhibit stationary characteristics, indicating potential mean-reverting tendencies.
Why it may be useful
Understanding the stationarity of a financial time series is crucial for developing effective trading strategies, particularly those involving mean-reversion. By identifying whether a series tends to fluctuate around a constant mean or follows a random walk, traders can make more informed decisions about potential trading approaches.
The test helps traders recognize that raw prices often trend and are not mean-reverting, which can prevent the application of inappropriate trading strategies. It provides a statistical foundation for understanding market behavior, distinguishing between trending and mean-reverting market conditions.
When to explore it
The Dickey-Fuller Test is most useful for traders developing longer-term strategies, particularly those interested in mean-reversion approaches. It is particularly valuable when analyzing financial instruments over extended periods, helping to identify potential statistical characteristics of price movements.
Traders should apply this test when considering strategies that rely on the assumption of mean reversion, such as pairs trading or statistical arbitrage. It is especially beneficial for swing traders looking to understand the underlying statistical properties of an asset's price movement over multiple time periods.
Keep exploring
What we’ve verified
Access, alerts and repainting behaviour have not been independently verified for this indicator. Check the creator’s current publication and settings.
General descriptions and classifications are recovered research. Verified details above identify the specific checks we have completed. Check the creator’s current publication for later changes.