YOUR INDICATOR RESEARCH STARTS HERE

Find the right indicator.
Understand what it does.

Explore 11,183 indicators. Filter beyond the obvious.
Discover the tools that fit the way you trade.

THE INDICATOR LIBRARY

Results for “mean-reversion”

11,183 tools to explore

43 indicators matching your filters
Save search
MomentumVolatility

Uptrick: Z-Score Flow

by Uptrick

A technical indicator that combines Z-Score, EMA trend, and RSI to identify statistically extreme price conditions while confirming trend direction and momentum for precise trade entries and exits.

Main price chart · unverifiedDay Trading · Swing Trading
Explore
1.1Klikes12.2Kviews0comments
Save
OscillatorSignalTrend

Moving Average Z-Score Suite [BackQuant]

by BackQuant

A statistical moving average indicator that transforms average prices into Z-Scores, helping traders identify trend strength, potential reversals, and mean-reversion opportunities across multiple markets.

Separate pane · unverifiedScalping · Day Trading
Explore
938likes14.8Kviews3comments
Save
TrendMomentumEditor’s pick

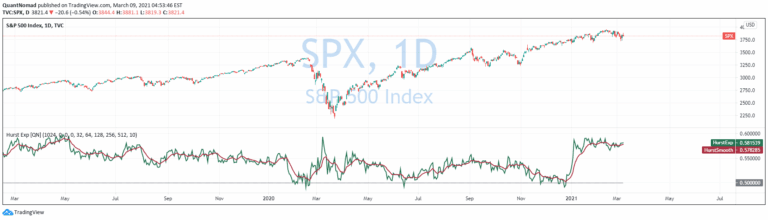
Hurst Exponent

by QuantNomad

The Hurst Exponent is a statistical measure that evaluates time series behavior, helping traders identify market trends, mean reversion, and potential future price movements.

Separate pane · unverifiedDay Trading · Swing Trading
Explore
861likes26.4Kviews10comments
Save
LevelsMomentumVolatility

multi-tf standard devs [keypoems]

by keypoems

A multi-timeframe standard deviation indicator that maps price volatility across different time intervals, revealing statistical price movements and potential trading opportunities.

Main price chart · unverifiedScalping · Day Trading
Explore
855likes7.6Kviews5comments
Save
MomentumSignalVolatility

Uptrick: Z-Trend Bands

by Uptrick

A dynamic trading signal using z-score bands and RSI momentum to identify mean-reversion opportunities with adaptive statistical filtering and robust entry confirmation.

Main price chart · unverifiedScalping · Day Trading
Explore
806likes8.4Kviews0comments
Save
MomentumOscillatorSignal

RSI OB/OS Strategy Analyzer

by Botnet101

RSI OB/OS Strategy Analyzer helps traders identify overbought/oversold market conditions by calculating Relative Strength Index and generating performance metrics for potential mean-reversion trades.

Separate pane · unverifiedScalping · Day Trading
Explore
446likes7.8Kviews1comments
Save

Likes, views, and comments are historical TradingView snapshots. They describe attention, not trading performance.

START WITH A QUESTION

A little less searching.
A lot more understanding.

Tell DeepAlpha what you need. Get an explanation, a shortlist,
and a direct path to the indicators behind it.

Ask DeepAlpha