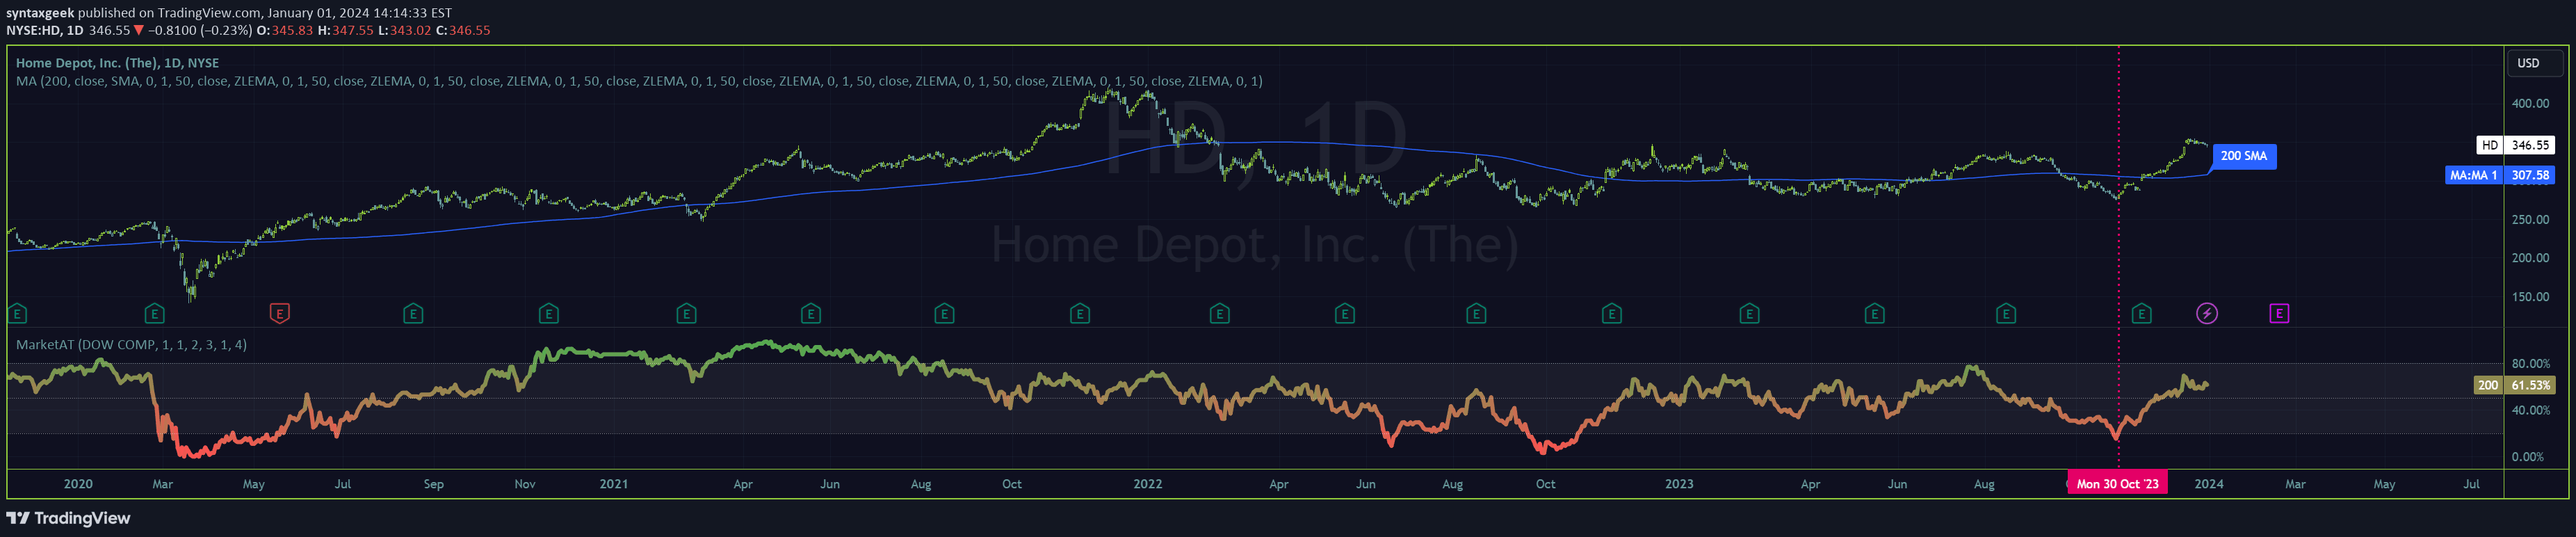
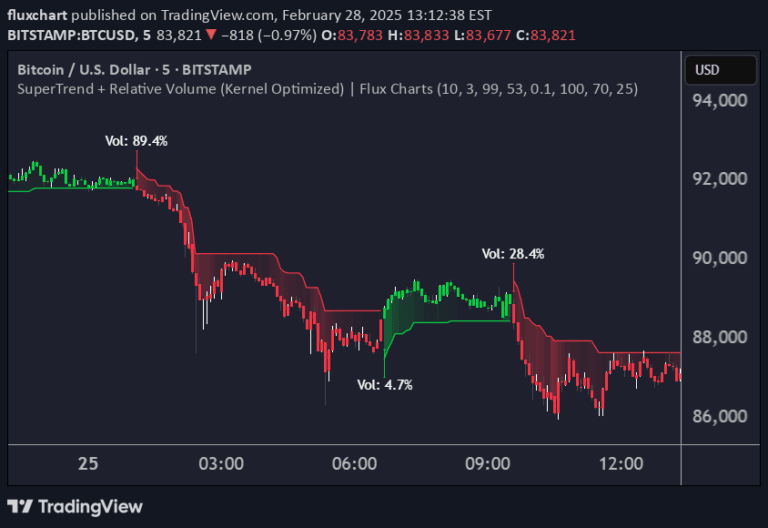
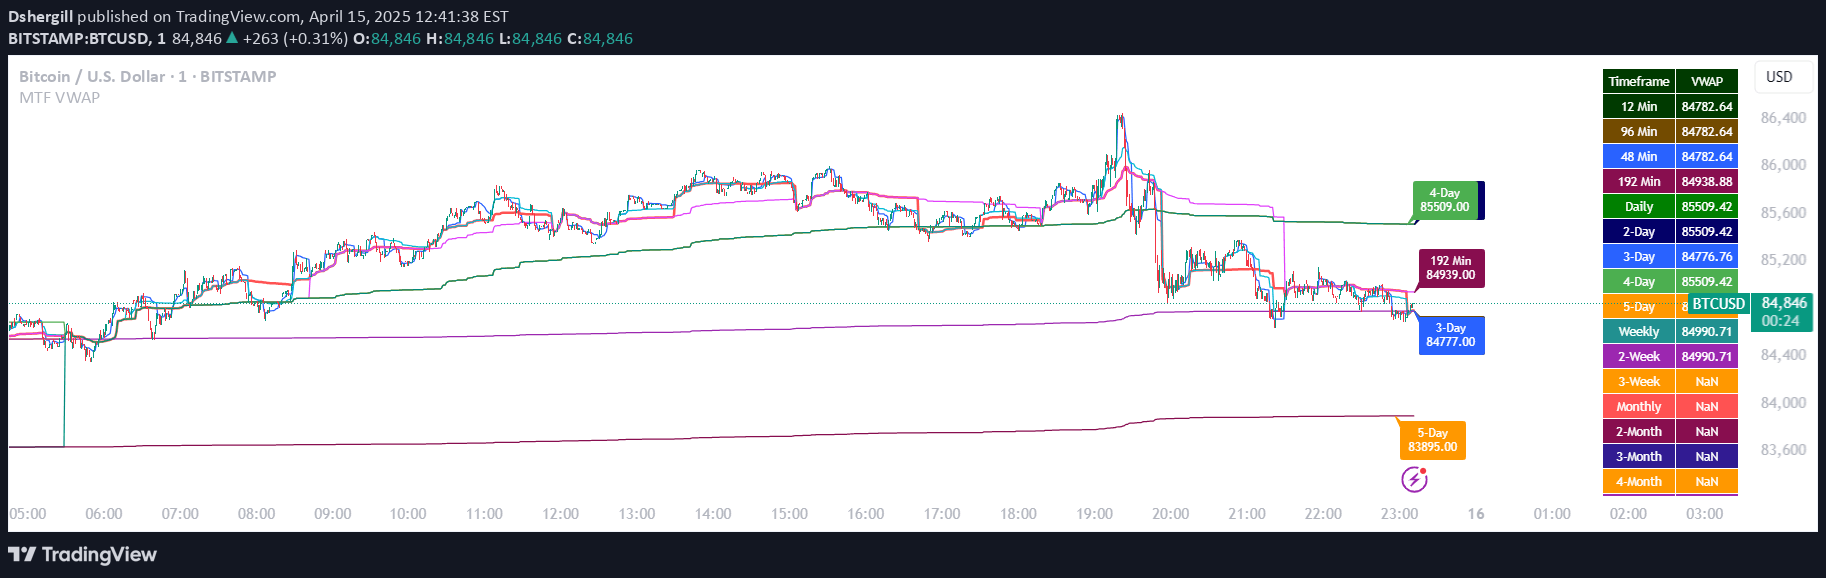
A script analyzing percentage distances of 11 S&P 500 sector indices from their moving averages, helping traders identify potential mean reversion and sector-specific extremes.
Explore complementary indicator rolesHow it works
The script calculates the percentage deviation of each S&P 500 sector from its 200-period moving average, providing a comparative view of sector performance. By measuring how far each sector has moved away from its average price, traders can quickly assess relative positioning and potential mean reversion opportunities.
The calculation involves comparing the current price to the 200 MA and expressing the difference as a percentage. This allows for a standardized view across different sectors, enabling traders to identify which sectors are potentially overextended or undervalued relative to their historical trends.
Why it may be useful
Understanding sector deviations from moving averages helps traders make more informed investment decisions by providing a macro-level view of market dynamics. This approach allows for quick identification of sectors that might be experiencing extreme price movements, which could signal potential trading opportunities or portfolio rebalancing needs.
By tracking percentage distances from moving averages, traders can develop mean reversion strategies that capitalize on sectors moving back towards their historical averages. This method provides a systematic approach to sector rotation and helps investors manage risk by identifying potential overbought or oversold conditions across different market segments.
When to explore it
This tool is most effective during periods of market transition or when sectors show significant divergence from their typical price ranges. Traders can use it to identify potential sector rotation opportunities, especially during market rotations or when specific sectors appear to be trending away from their historical norms.
The signal works best when combined with other technical and fundamental analysis tools, providing an additional layer of insight into sector performance. It is particularly useful for traders looking to make data-driven decisions about sector allocation, momentum trading, or identifying potential mean reversion opportunities across different market segments.
Keep exploring
What we’ve verified
Access, alerts and repainting behaviour have not been independently verified for this indicator. Check the creator’s current publication and settings.
General descriptions and classifications are recovered research. Verified details above identify the specific checks we have completed. Check the creator’s current publication for later changes.