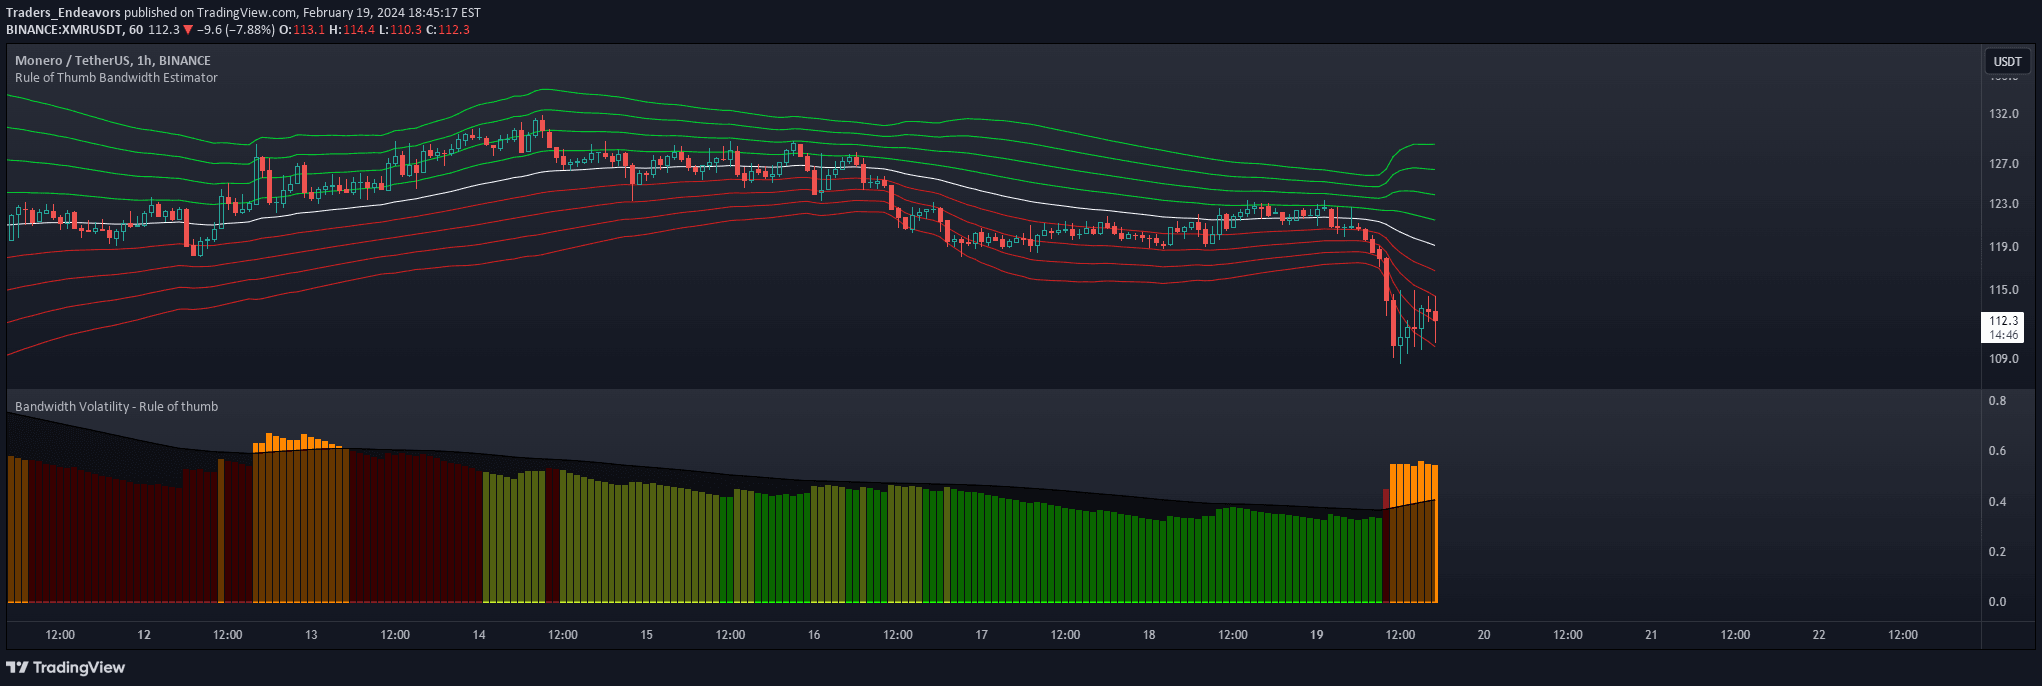
A script analyzing 14-day volatility using ATR percentage for cryptocurrencies and stocks, identifying top 5 most volatile assets and comparing them to Bitcoin's volatility.
Explore complementary indicator rolesHow it works
The script utilizes the Average True Range (ATR) percentage to calculate 14-day volatility across a predefined list of cryptocurrencies and stocks. It gathers daily timeframe data from TradingView and computes the volatility for each asset, allowing for a comprehensive comparison of market fluctuations.
Once the calculations are complete, the script ranks the assets in descending order based on their volatility levels. It then highlights the top 5 most volatile coins, providing traders with a clear snapshot of which assets are experiencing the most significant price movements during the specified period.
Why it may be useful
Volatility analysis is crucial for traders seeking to understand market dynamics and potential trading opportunities. By comparing different assets' volatility, traders can identify which markets are most active and potentially more profitable for short-term trading strategies.
The script's ability to automatically update daily and provide a ranked list of volatile assets helps traders quickly assess market conditions without manual research. This systematic approach enables more informed decision-making and can help traders align their strategies with current market movements.
When to explore it
This volatility analysis tool is most effective during periods of market uncertainty or when traders want to diversify their trading approach across multiple assets. It is particularly useful for those interested in identifying assets with significant price movements that could present potential trading opportunities.
Traders can leverage this script during market transitions, sector rotations, or when seeking to compare volatility across different cryptocurrency and stock markets. It is especially valuable for momentum traders, scalpers, and day traders who thrive on identifying and capitalizing on short-term price fluctuations.
Keep exploring
What we’ve verified
Access, alerts and repainting behaviour have not been independently verified for this indicator. Check the creator’s current publication and settings.
General descriptions and classifications are recovered research. Verified details above identify the specific checks we have completed. Check the creator’s current publication for later changes.