Order Blocks with Volume Heatmap & Clusters - VK Trading
Advanced trading tool identifying order blocks, volume heatmaps, and institutional accumulation clusters to enhance market analysis and trading decision-making.
Explore 11,183 indicators. Filter beyond the obvious.
Discover the tools that fit the way you trade.
11,183 tools to explore
Advanced trading tool identifying order blocks, volume heatmaps, and institutional accumulation clusters to enhance market analysis and trading decision-making.
A multi-indicator trading script that generates buy and sell signals by analyzing price pivots, helping traders identify potential market entry and exit points across different timeframes.
A linear regression indicator that calculates average price deviation and visualizes trend direction through color-coded lines and dispersion markers.
A Pine Script utility that enables multi-timeframe (MTF) analysis for seconds-based intervals, offering traders a flexible method to calculate and analyze price data across different second-based timeframes.
A comprehensive multi-timeframe trend analysis dashboard that combines multiple technical indicators to provide traders with a clear, concise view of market direction across different time periods.
A comprehensive trading tool using TICK data to define market cumulative trend, displaying trend direction through ATR EMA bands with customizable settings for various market analyses.
An advanced market forecast indicator using stochastic oscillators, moving averages, and momentum calculations to identify potential trading opportunities across different timeframes.
A technical analysis method identifying market consolidation periods using a forecast oscillator to highlight price movements within support and resistance ranges.
SPTS is a comprehensive statistical trading package offering advanced mathematical functions including t-tests, correlations, regressions, and distribution analysis for traders seeking deeper quantitative insights.
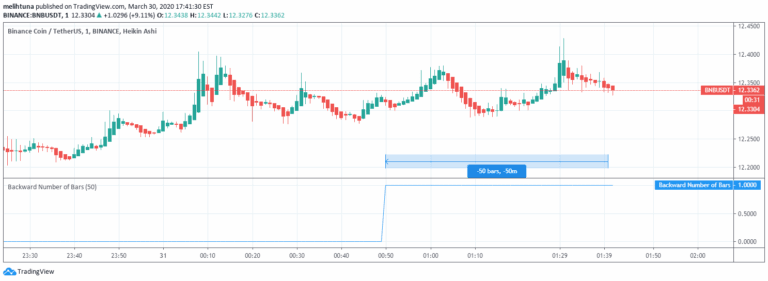
A trading signal that helps traders set bar limits during backtesting, enabling precise strategy evaluation by controlling the number of historical bars used in analysis.
A multi-timeframe indicator that identifies Inverse Fair Value Gaps (IFVGs) across chart intervals, helping traders spot liquidity voids and potential reversal zones using institutional order flow patterns.
A TradingView indicator that adds customizable watermarks to charts, displaying essential trading information like date, symbol, and timeframe for easy reference and sharing.
Likes, views, and comments are historical TradingView snapshots. They describe attention, not trading performance.