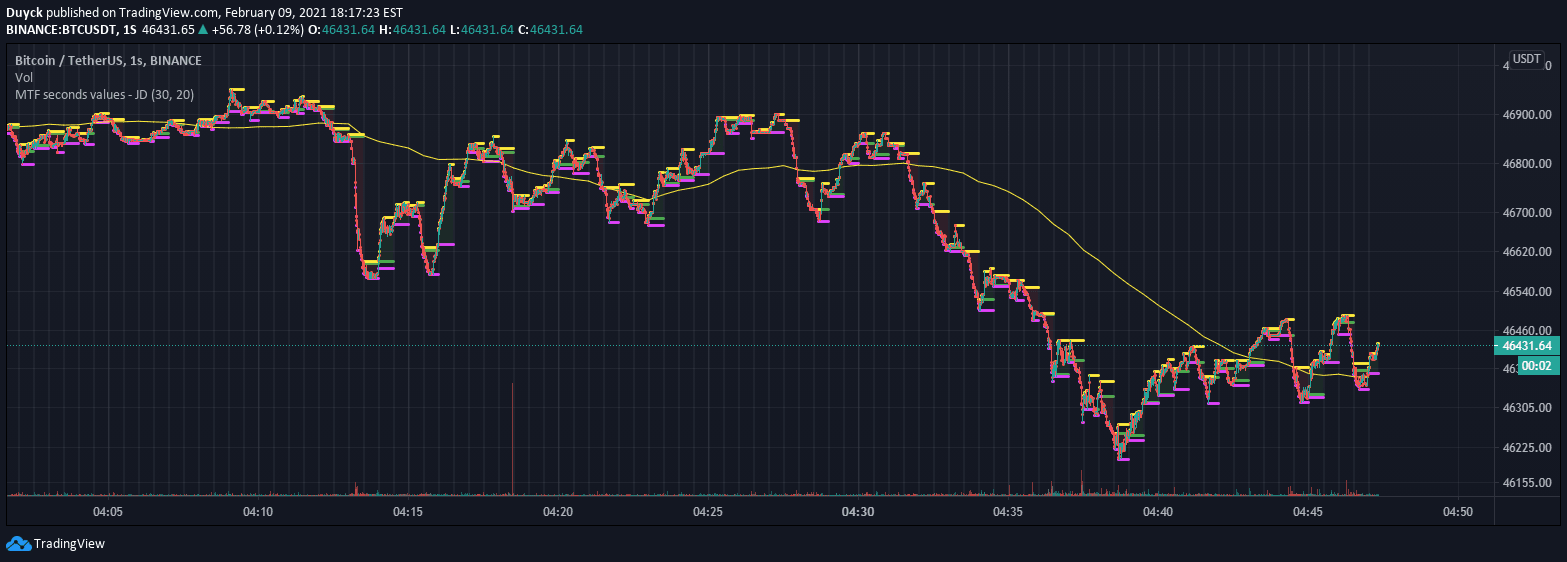
A Pine Script utility that enables multi-timeframe (MTF) analysis for seconds-based intervals, offering traders a flexible method to calculate and analyze price data across different second-based timeframes.
Explore complementary indicator rolesHow it works
This Pine Script technique uses arrays to overcome the limitation of the standard resolution function, which doesn't support seconds-based multi-timeframe analysis. By creating custom arrays of MTF values, traders can perform complex calculations across different second intervals.
The script allows dynamic calculation and manipulation of price data, enabling users to extract meaningful insights from various second-based timeframes. Users can implement custom calculations like Simple Moving Averages (SMA) or other statistical analyses on these arrays. The technique provides a workaround for the standard Pinescript resolution constraints
Why it may be useful
Multi-timeframe analysis is crucial for traders seeking comprehensive market insights beyond single timeframe perspectives. This script empowers traders to analyze price movements across multiple second intervals simultaneously, enhancing decision-making capabilities.
By bridging the gap in Pinescript's native MTF capabilities, traders can develop more nuanced trading strategies. The flexibility to perform calculations across different timeframes allows for more robust trend identification and potential trading signal generation. This approach provides a significant advantage in understanding complex market dynamics
When to explore it
This MTF seconds technique is most effective for high-frequency traders and algorithmic trading strategies requiring granular market analysis. It's particularly useful during volatile market conditions where second-by-second price movements are critical.
Scalpers and day traders will find this approach most beneficial for identifying rapid price changes and potential entry/exit points. The technique works best with liquid markets and assets that exhibit significant intraday volatility. Traders should combine this method with other technical indicators for comprehensive market analysis
Keep exploring
What we’ve verified
Access, alerts and repainting behaviour have not been independently verified for this indicator. Check the creator’s current publication and settings.
General descriptions and classifications are recovered research. Verified details above identify the specific checks we have completed. Check the creator’s current publication for later changes.