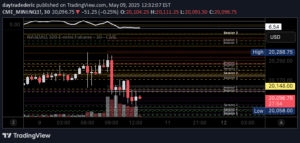
MM Day Trader Levels
An advanced intraday trading indicator that automatically tracks critical price levels, including previous day's high/low, value area, and key market session points for precise trading insights.
Explore 11,183 indicators. Filter beyond the obvious.
Discover the tools that fit the way you trade.
11,183 tools to explore
An advanced intraday trading indicator that automatically tracks critical price levels, including previous day's high/low, value area, and key market session points for precise trading insights.
A day trading indicator that tracks and displays key price levels throughout the trading session, helping traders identify potential support and resistance zones.
A multi-level momentum indicator that dynamically identifies and categorizes supply and demand levels, providing insights into market transaction pressure and trend direction.
Sebastine Trend Catcher is a trend-following indicator that identifies market direction by tracking line crossovers above and below a zero signal line, providing clear entry and exit points.
A comprehensive day trading indicator combining multiple technical analysis tools to generate precise entry and exit signals with multiple layers of market trend confirmation.
An indicator that identifies inside candles to predict potential market direction by analyzing the relationship between consecutive candles and providing buy or sell signals.
An intraday indicator that draws key price levels like RTH high/low, ETH levels, and day close to help traders identify potential support and resistance zones.
Fibonacci retracement tool that automatically draws support and resistance levels on charts, helping traders identify potential price reversal points during trading sessions.
A custom Fibonacci Retracement and Extension indicator that tracks multiple trading sessions, helping traders identify key price levels and potential market movements with precision.
A Monday trading range indicator that calculates and highlights the lowest and highest prices during a specific trading session, with customizable time and day settings.
A weekly trading indicator that uses Monday's price range to calculate Fibonacci levels, helping traders identify potential support, resistance, and price movement zones.
A dynamic trading tool that helps traders organize daily market strategies by visually displaying trend, bias, and key price levels directly on the chart for efficient decision-making.
Likes, views, and comments are historical TradingView snapshots. They describe attention, not trading performance.