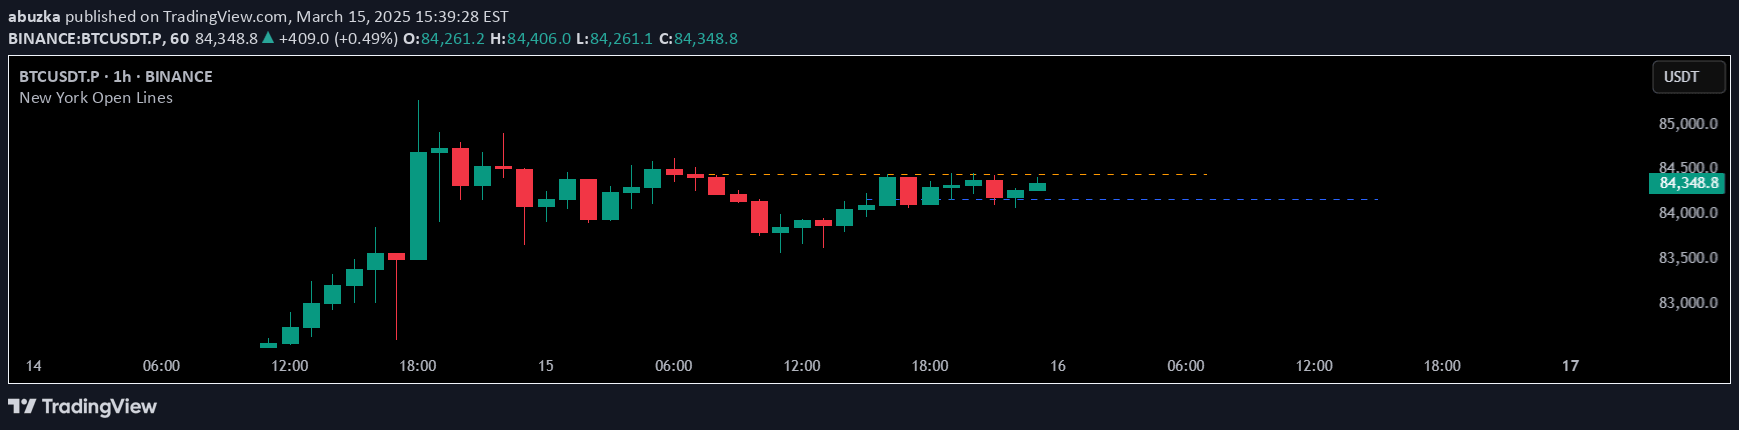
An advanced intraday trading indicator that automatically tracks critical price levels, including previous day's high/low, value area, and key market session points for precise trading insights.
Explore complementary indicator rolesHow it works
The indicator automatically identifies and plots critical price levels for intraday traders, including yesterday's high and low, value area high and low, point of control, today's open, and previous day's close. It uses a sophisticated session volume profile library that can differentiate between various trading sessions, particularly for futures markets.
The system creates shaded backgrounds for each level to enhance visibility and provides customizable configuration options. Traders can modify color settings, hide specific levels, adjust label properties, and fine-tune volume profile parameters to suit their individual trading preferences and strategies.
Why it may be useful
This indicator simplifies the complex process of manually marking key price levels, saving traders significant time and reducing potential errors in chart analysis. By automatically generating critical price points, it helps traders quickly identify potential support and resistance zones, entry and exit points, and market sentiment without extensive manual preparation.
The sophisticated session volume profile library provides unique insights into market structure, especially for futures trading, where standard tools often fall short. Its ability to accurately distinguish between different trading sessions and provide precise volume profile information gives traders a significant competitive advantage in understanding market dynamics.
When to explore it
The indicator is most effective for intraday traders focusing on short-term price movements, particularly those trading stocks, futures, and other instruments with clear daily session characteristics. It works best in volatile markets where understanding previous session levels can provide critical trading insights and potential reversal or continuation points.
Traders will find maximum value when using this tool in actively traded markets with sufficient liquidity, where historical price levels and volume profiles can reliably predict potential market behavior. It is especially powerful for traders who rely on technical analysis and seek to understand market structure beyond simple price action.
Keep exploring
What we’ve verified
Access, alerts and repainting behaviour have not been independently verified for this indicator. Check the creator’s current publication and settings.
General descriptions and classifications are recovered research. Verified details above identify the specific checks we have completed. Check the creator’s current publication for later changes.