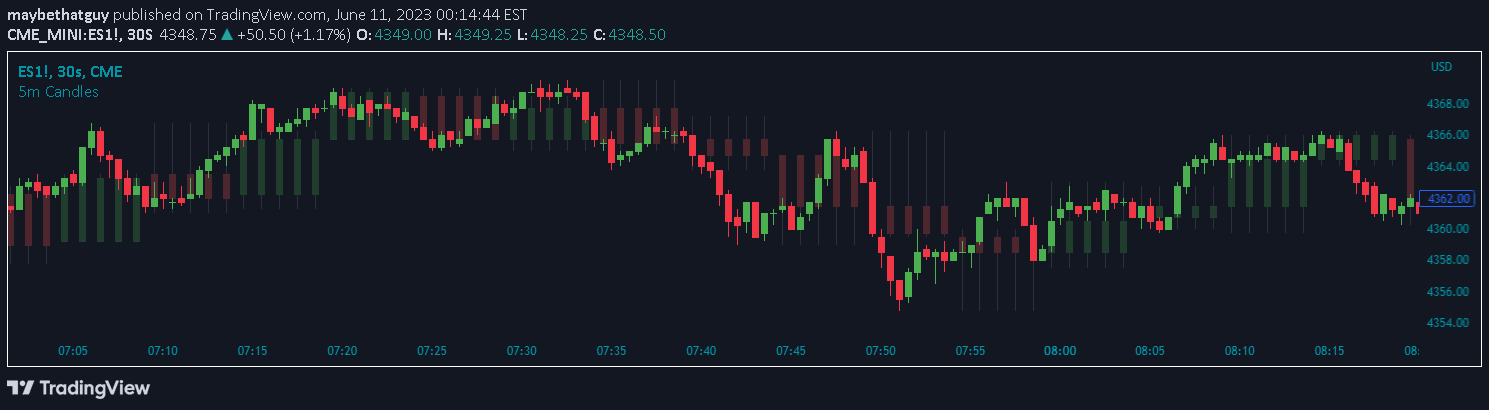
An indicator that identifies inside candles to predict potential market direction by analyzing the relationship between consecutive candles and providing buy or sell signals.
Explore complementary indicator rolesHow it works
The inside candle indicator identifies a specific candlestick pattern where the current candle's high and low are completely contained within the previous candle's range. This signals a potential pause or consolidation in the current price movement. When an inside candle forms, traders wait for the next candle to break either above or below the inside candle's range.
A breakout above the inside candle generates a buy signal, suggesting potential upward momentum. Conversely, a breakout below the inside candle creates a sell signal, indicating potential downward price movement. The indicator provides visual labels to easily identify inside candle formations on live charts.
Why it may be useful
This indicator helps traders identify potential trend continuation or reversal points by recognizing moments of market indecision. By focusing on the relationship between consecutive candles, traders can gain insights into potential price movements and make more informed trading decisions.
The inside candle strategy provides a structured approach to trading, offering clear entry and exit signals based on price action. It helps traders manage risk by suggesting specific breakout points and recommending a consistent risk-reward ratio of 1:2, which can help improve overall trading performance and discipline.
When to explore it
The inside candle indicator works best in trending markets where price has a clear directional bias. It is particularly effective when applied to 15-minute charts, which provide a balanced view of short-term price movements. Traders should look for this pattern in markets with consistent momentum and avoid using it in ranging or choppy market conditions.
To maximize effectiveness, traders should combine this indicator with other technical analysis tools and confirm signals with additional confluence factors. It is most reliable when used on liquid markets with sufficient trading volume, such as major stocks, cryptocurrencies, and commodity markets.
Keep exploring
What we’ve verified
Access, alerts and repainting behaviour have not been independently verified for this indicator. Check the creator’s current publication and settings.
General descriptions and classifications are recovered research. Verified details above identify the specific checks we have completed. Check the creator’s current publication for later changes.