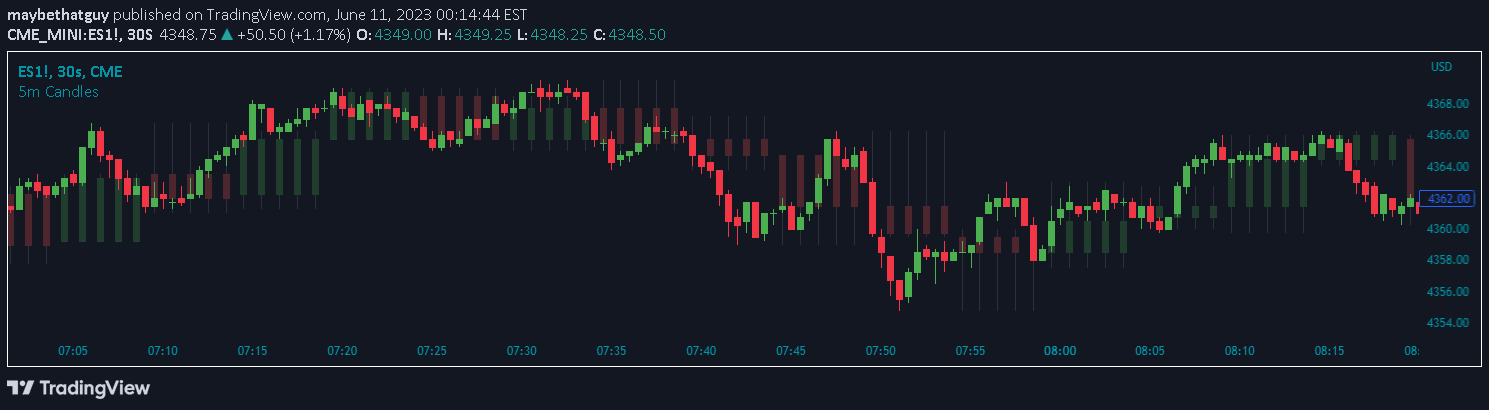
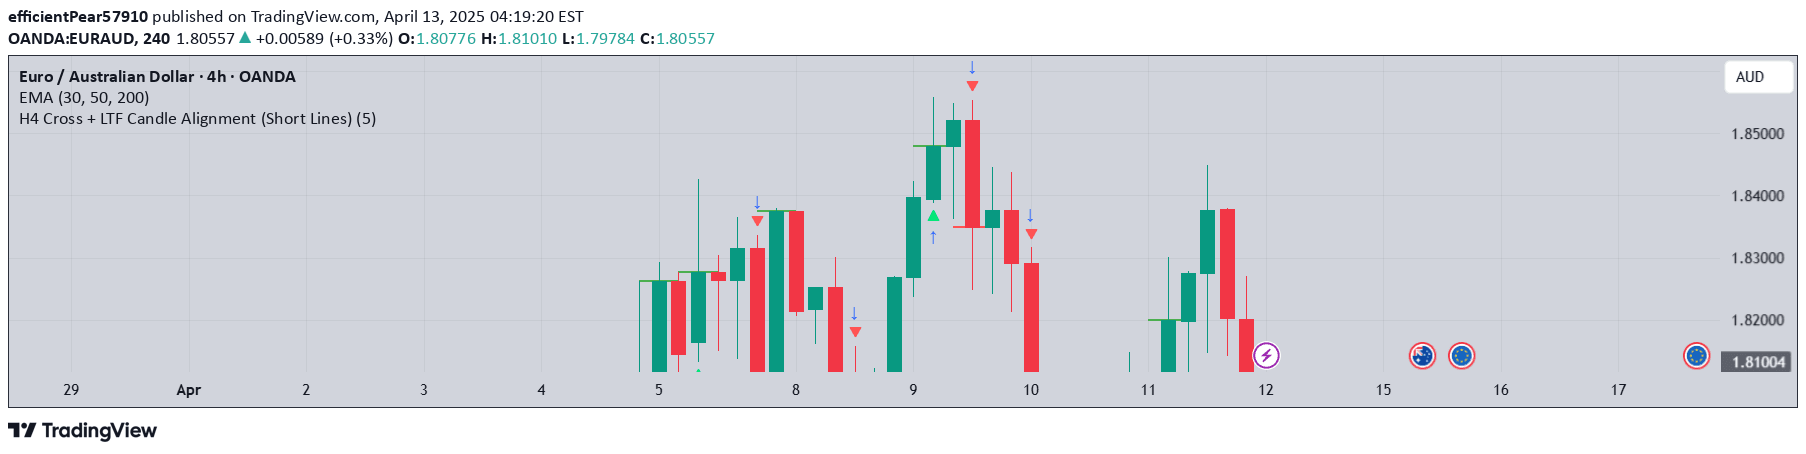
A multi-timeframe candle overlay indicator that provides a comprehensive view of price action across different time periods, helping traders analyze market dynamics more holistically.
Explore complementary indicator rolesHow it works
The Candle Blocks indicator operates by overlaying candles from higher timeframes directly onto the current chart, creating a multi-dimensional view of price action. It selects candles from chosen timeframes like hourly, daily, or weekly and displays them with distinct color coding to differentiate between bullish and bearish candles.
The overlay updates in real-time as new higher timeframe candles form, allowing traders to simultaneously view price movements across multiple time periods. Traders can customize the opacity of the overlay to ensure the primary chart remains visible while providing additional context about broader market trends and price dynamics.
Why it may be useful
The Candle Blocks indicator is crucial for traders seeking a more comprehensive understanding of market movements beyond their primary timeframe. By presenting multiple timeframe perspectives simultaneously, it helps traders validate trend directions, identify stronger support and resistance levels, and make more informed trading decisions.
This approach moves trading analysis towards a fourth-dimensional perspective, where time is considered a vector rather than a linear constraint. The indicator bridges the gap between different timeframe perspectives, enabling traders to see broader market context and potentially improve their strategic decision-making process.
When to explore it
The Candle Blocks indicator is most effective when traders want to confirm trends across multiple timeframes and gain a more holistic view of market dynamics. It is particularly useful during periods of market uncertainty, where understanding broader price action can provide critical insights into potential future movements.
Traders should utilize this indicator when transitioning between different trading styles or when they need to validate their current trading thesis against a broader market context. It is especially valuable for traders who want to understand the relationship between short-term price movements and longer-term market trends.
Keep exploring
What we’ve verified
Access, alerts and repainting behaviour have not been independently verified for this indicator. Check the creator’s current publication and settings.
General descriptions and classifications are recovered research. Verified details above identify the specific checks we have completed. Check the creator’s current publication for later changes.