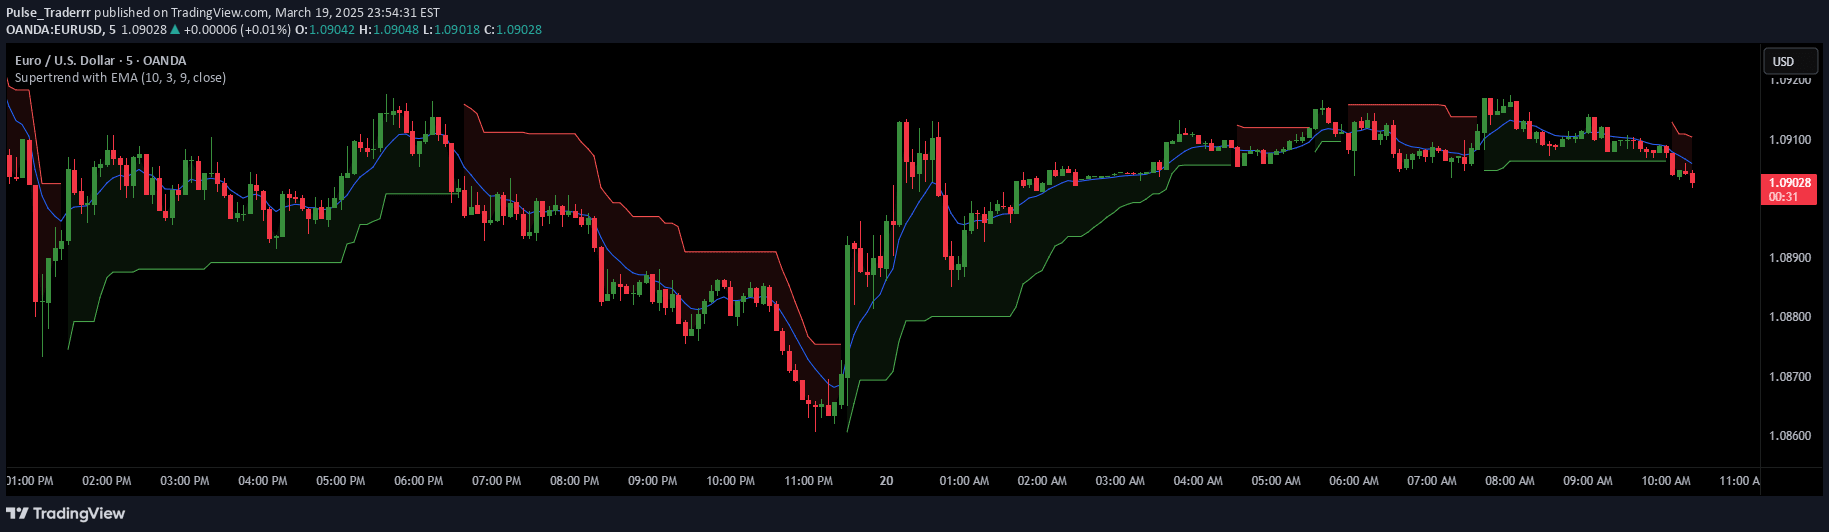
A dynamic trend-following indicator using Average True Range to identify market direction with color-coded support and resistance lines signaling potential buy and sell opportunities.
Explore complementary indicator rolesHow it works
The Supertrend indicator calculates a dynamic trend line using the Average True Range (ATR) and price data. It generates a line that acts as a dynamic support or resistance level, changing color based on market trend. When the price crosses above the line, it signals a potential bullish trend, represented by a green indicator.
When the price crosses below the line, it indicates a potential bearish trend, shown in red. The calculation involves multiplying the ATR by a factor to create a buffer zone around the price. This adaptive mechanism allows the indicator to adjust to changing market volatility, providing traders with a responsive tool for identifying trend shifts and potential entry or exit points.
Why it may be useful
The Supertrend indicator helps traders quickly visualize market trends and potential trading opportunities with its color-coded signal system. By combining price movement with volatility measurements, it provides a comprehensive view of market dynamics that can improve decision-making.
The indicator's ability to adapt to changing market conditions makes it a versatile tool for identifying trend strength and potential reversals. Unlike static indicators, the Supertrend's dynamic nature allows traders to capture trend changes more effectively. Its simple visual representation reduces complexity, enabling traders to make faster and more informed trading decisions across different market conditions and timeframes.
When to explore it
The Supertrend indicator works best in trending markets with clear directional movements, making it ideal for traders seeking to capture sustained price trends. It is particularly effective in markets showing consistent bullish or bearish momentum, where price movements are more predictable. Traders can use this indicator across various financial instruments and timeframes, from stocks and forex to cryptocurrencies.
However, the indicator may produce less reliable signals during choppy or sideways market conditions with frequent price reversals. Traders should combine the Supertrend with other technical analysis tools to confirm signals and reduce false positives. It is most effective when used alongside volume indicators, support and resistance levels, and additional trend-confirmation methods.
Keep exploring
What we’ve verified
Access, alerts and repainting behaviour have not been independently verified for this indicator. Check the creator’s current publication and settings.
General descriptions and classifications are recovered research. Verified details above identify the specific checks we have completed. Check the creator’s current publication for later changes.