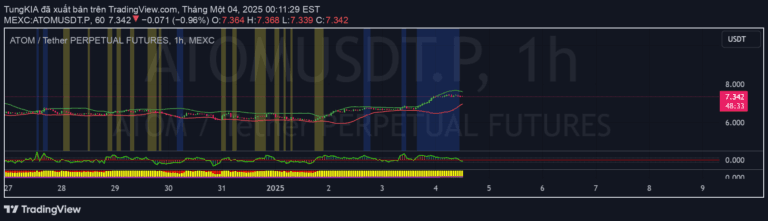
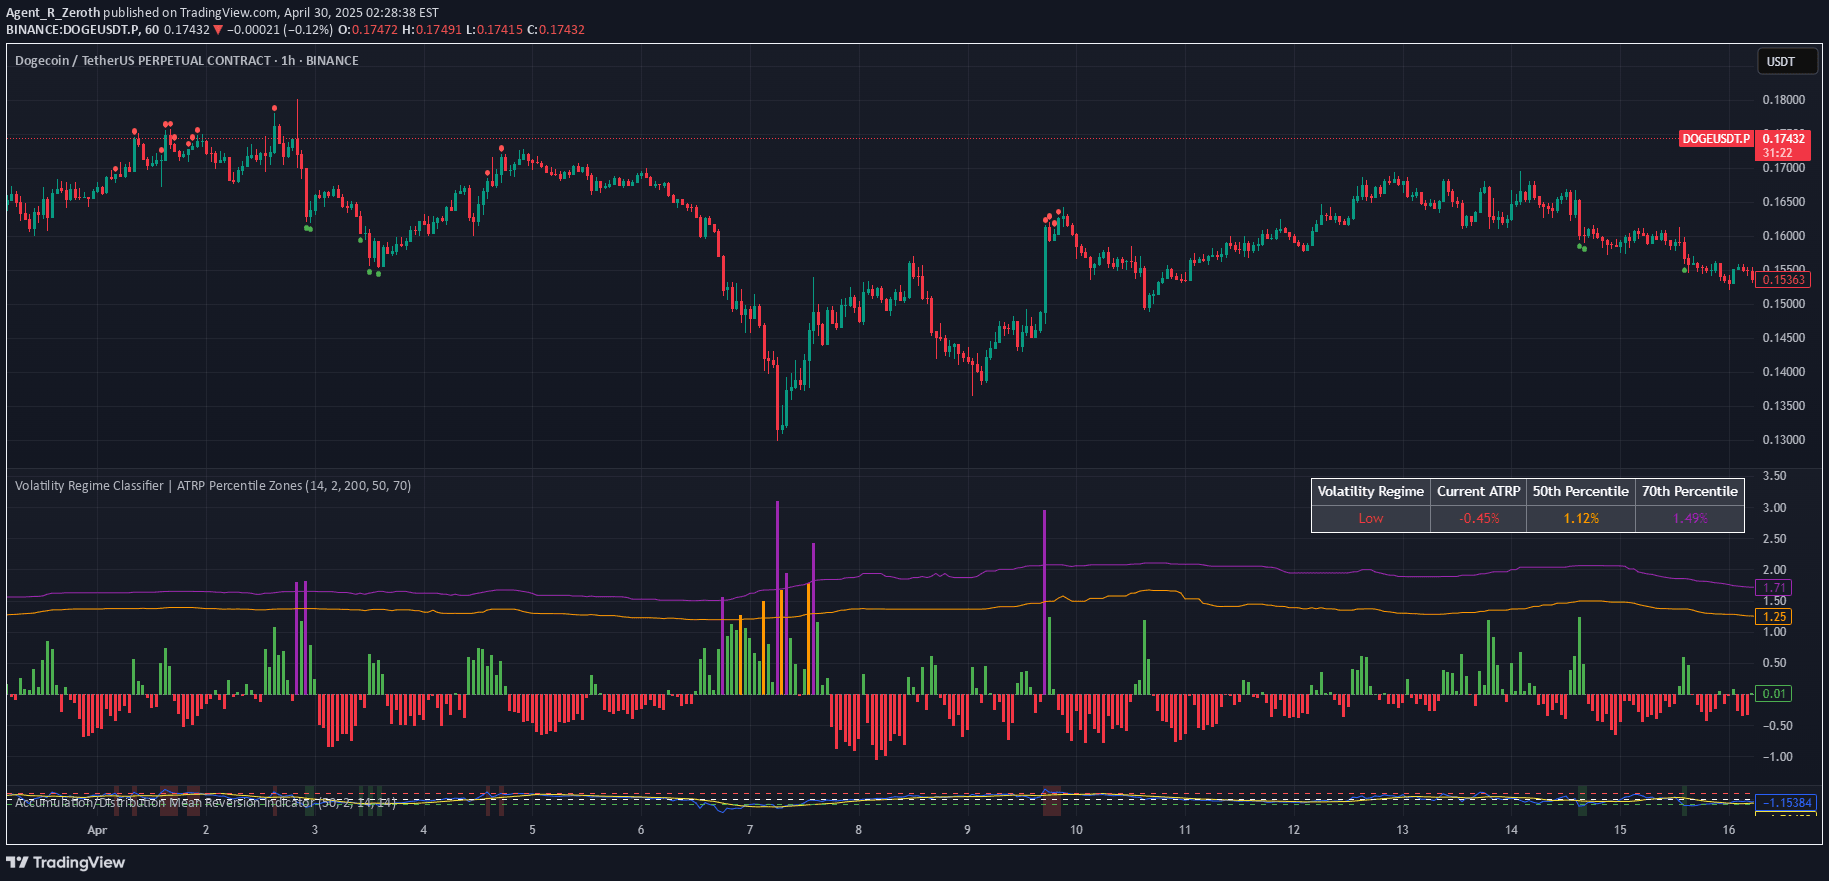
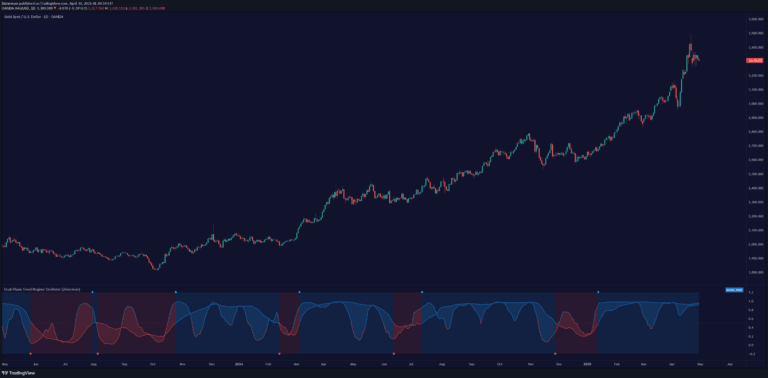
A sophisticated market forecasting indicator that combines historical price patterns, recency-weighted drift, and quantile-based volatility analysis to predict potential future price movements.
Explore complementary indicator rolesHow it works
The Recency-Weighted Market Memory indicator analyzes historical market conditions by identifying past periods with similar correlation, momentum, and price characteristics. It selects matching historical bars within a defined lookback window, evaluating factors like price change correlation with volume and rate of change (RoC).
The indicator then applies recency weighting to recent market movements, giving higher importance to more recent bars. It calculates drift percentages, filters historical matches through correlation and momentum criteria, and uses quantile-based analysis to measure volatility and potential price direction.
Why it may be useful
This indicator provides traders with a sophisticated, data-driven approach to understanding potential future price movements by leveraging historical market similarities. It goes beyond simple trend following by incorporating complex filtering mechanisms that account for correlation, momentum, and volatility dynamics.
By combining multiple analytical techniques, the indicator offers a nuanced view of market behavior, helping traders identify potential price trajectories with greater precision and context than traditional single-dimensional indicators.
When to explore it
The indicator is most effective in markets with moderate to high predictability, where historical patterns tend to repeat with some consistency. It works best in liquid markets with sufficient historical data and when market conditions show recognizable correlation and momentum characteristics.
Traders should use this tool as a complementary analysis technique, combining its insights with other technical and fundamental indicators to validate potential trading opportunities and enhance overall decision-making processes.
Keep exploring
What we’ve verified
Access, alerts and repainting behaviour have not been independently verified for this indicator. Check the creator’s current publication and settings.
General descriptions and classifications are recovered research. Verified details above identify the specific checks we have completed. Check the creator’s current publication for later changes.