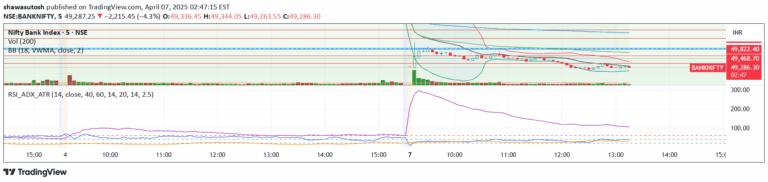
An advanced volatility tracking indicator that visualizes market turbulence through a multi-layered histogram and ribbon system, revealing volatility structure and momentum.
Explore complementary indicator rolesHow it works
The Asymmetric Turbulence Ribbon (ATR) operates through two primary visual systems: a zero-centered histogram and a braided ribbon of moving averages. The histogram shows current volatility relative to historical averages, with color and opacity indicating volatility intensity and market conviction. The ribbon consists of two moving averages - an exponential moving average (EMA) and a hull moving average (HMA) - which track volatility rhythm and structural changes.
The indicator calculates volatility using a configurable lookback period, comparing current market behavior against historical baselines. Color-coded histogram bars represent volatility expansion or contraction, while the ribbon's fill and crossover points signal transitions in market energy and potential directional shifts.
Why it may be useful
Traditional volatility indicators often provide limited insights, but the Asymmetric Turbulence Ribbon offers a nuanced, multi-dimensional view of market dynamics. By combining color-coded intensity, opacity-based conviction, and dual moving average tracking, traders gain deeper insights into market structure and potential trend changes.
This comprehensive approach helps traders distinguish between meaningful volatility shifts and mere market noise. The indicator's unique design allows traders to detect volatility expansions before breakouts, identify compression zones, and assess the efficiency of price movements. Its ability to visualize market energy and rhythm provides traders with a sophisticated tool for understanding underlying market mechanics beyond simple price action.
When to explore it
The Asymmetric Turbulence Ribbon is most effective in identifying volatility transitions across various market conditions and timeframes. It excels in detecting potential breakouts, understanding market compression zones, and revealing shifts in market momentum. Traders can leverage this indicator during periods of market uncertainty, when traditional trend-following tools might provide incomplete information.
Optimal usage includes intraday to daily timeframes, with particular strength in 1-hour to daily charts. The indicator's timeframe override feature allows traders to anchor analysis in higher-timeframe volatility context, making it versatile for different trading styles and market environments. It's especially useful when combined with other structural or order flow tools to confirm high-quality trade setups.
Keep exploring
What we’ve verified
Access, alerts and repainting behaviour have not been independently verified for this indicator. Check the creator’s current publication and settings.
General descriptions and classifications are recovered research. Verified details above identify the specific checks we have completed. Check the creator’s current publication for later changes.