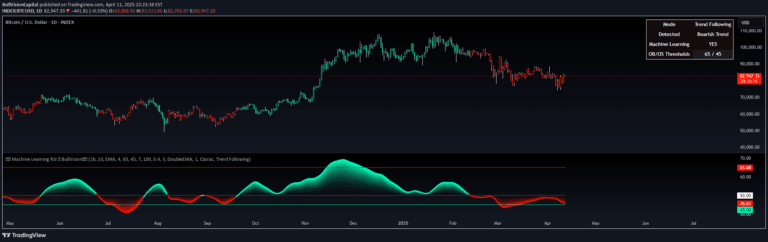
A custom TradingView indicator that enhances RSI by incorporating SMA and standard deviation bands to provide clearer trend signals and market analysis for swing traders.
Explore complementary indicator rolesHow it works
The Standard Deviation SMA RSI calculates the Relative Strength Index with a Simple Moving Average overlay to smooth RSI fluctuations. Standard deviation bands are added to measure price volatility and market dynamics.
The indicator uses configurable parameters like RSI length, SMA length, and standard deviation period. The RSI line changes color based on trend conditions, with green indicating uptrend, pink showing downtrend, and gray representing neutral market states. Threshold lines help identify potential entry and exit points
Why it may be useful
This indicator provides traders with a sophisticated approach to understanding market trends and potential reversals. By combining RSI, SMA, and standard deviation, it offers a more nuanced view of market conditions than traditional single-indicator analysis.
The dynamic color-coding and threshold lines help traders quickly interpret market sentiment. It helps identify overbought and oversold conditions, trend strength, and potential mean reversion opportunities with greater precision
When to explore it
The Standard Deviation SMA RSI works best on higher timeframes, particularly 12-hour, daily, and weekly charts. It is most effective for swing traders and long-term investors seeking to capture sustained trend movements.
The indicator is not recommended for scalping or very short-term trading strategies. Traders should use it in conjunction with other technical analysis tools to confirm signals and validate potential trade entries and exits
Keep exploring
What we’ve verified
Access, alerts and repainting behaviour have not been independently verified for this indicator. Check the creator’s current publication and settings.
General descriptions and classifications are recovered research. Verified details above identify the specific checks we have completed. Check the creator’s current publication for later changes.