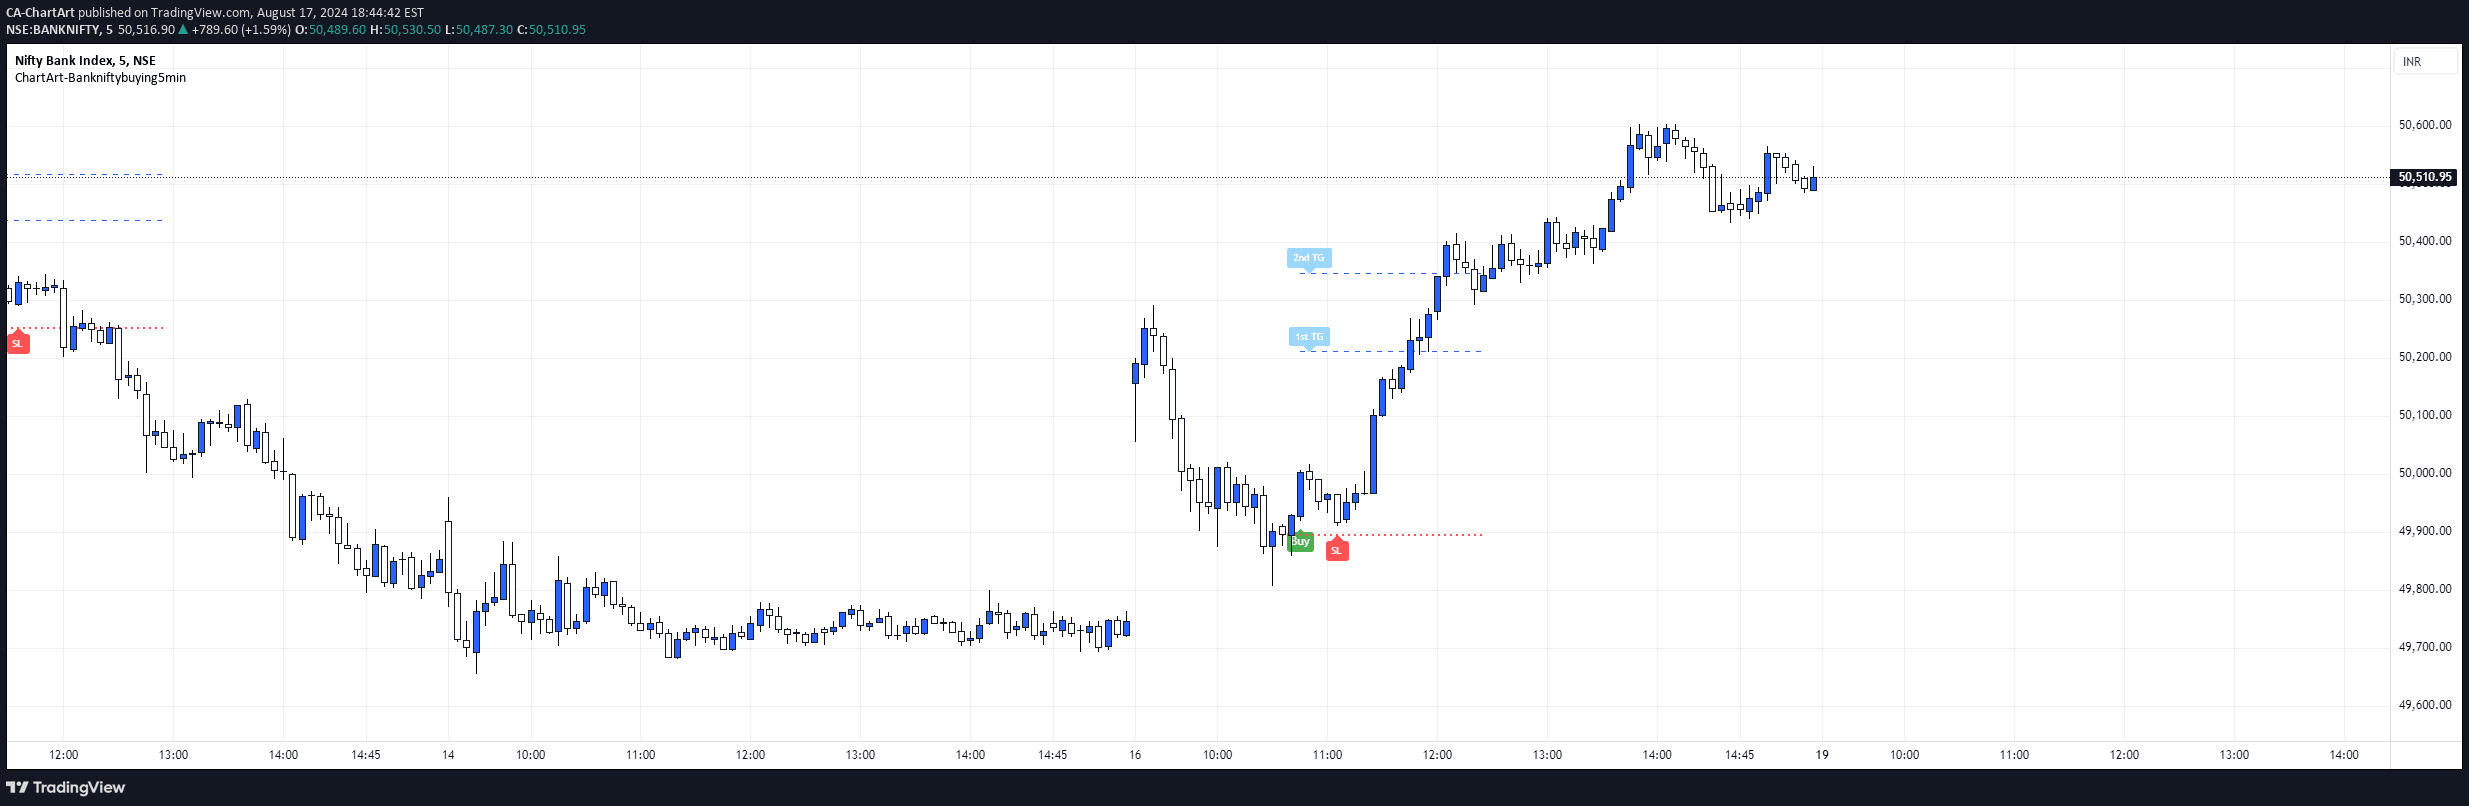
A powerful trading indicator combining SMA200 and RSI to identify potential bullish entry zones by analyzing market trend and momentum in a single signal.
Explore complementary indicator rolesHow it works
The SMA200 & RSI Signal Indicator works by simultaneously analyzing two key technical indicators to generate trading signals. First, it checks the price position relative to the 200-day Simple Moving Average, which provides insight into the overall market trend and potential bullish conditions.
Simultaneously, the indicator evaluates the Relative Strength Index (RSI) to measure momentum and identify potential oversold zones. When the price is above the SMA200 and the RSI falls between 20 and 40, the indicator triggers a green background highlight, signaling a potential entry point for traders.
Why it may be useful
This indicator is crucial for traders seeking to combine trend analysis with momentum indicators for more informed trading decisions. By integrating the SMA200's trend-following capabilities with the RSI's momentum measurement, traders can gain a more comprehensive view of market conditions and potential trading opportunities.
The combination of these two indicators helps traders identify high-probability entry points by confirming both the overall market trend and temporary pullback zones. This approach reduces the likelihood of entering trades against the primary market direction and provides a more nuanced approach to technical analysis.
When to explore it
The SMA200 & RSI Signal Indicator is most effective in trending markets with clear directional momentum. It works particularly well in assets that demonstrate consistent price movements and are experiencing a bullish trend with periodic pullbacks.
Traders should use this indicator in conjunction with other analysis methods to confirm signals and manage risk. It is especially useful for day traders and swing traders looking to identify potential entry points during temporary market retracements while maintaining alignment with the broader market trend.
Keep exploring
What we’ve verified
Access, alerts and repainting behaviour have not been independently verified for this indicator. Check the creator’s current publication and settings.
General descriptions and classifications are recovered research. Verified details above identify the specific checks we have completed. Check the creator’s current publication for later changes.