
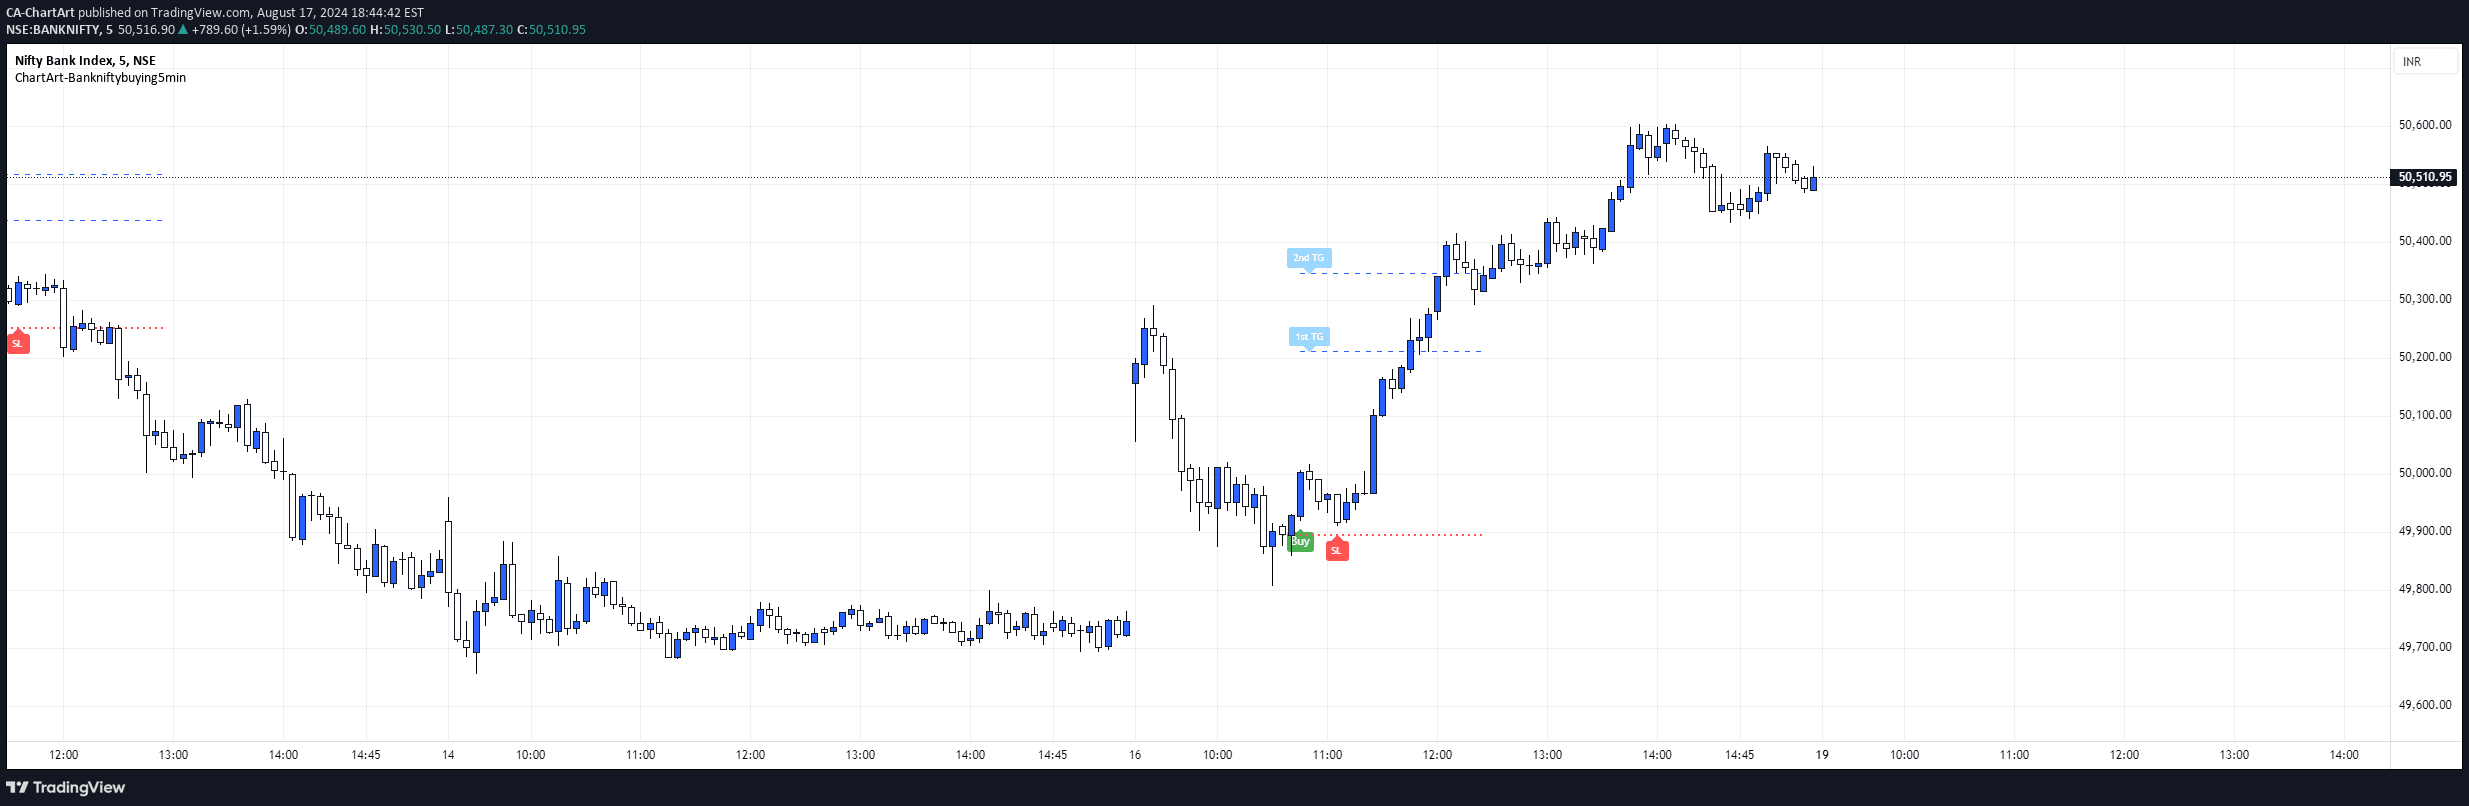
A precise intraday trading strategy for BankNifty using moving averages, RSI, and candlestick patterns to identify potential reversals during minor downtrends with structured entry and exit rules.
Explore complementary indicator rolesHow it works
The ChartArt-BankNifty strategy uses a multi-step technical analysis approach to identify potential trading opportunities. It first analyzes the market trend by comparing 7-period and 5-period exponential moving averages to confirm a minor downtrend, ensuring the market is in a specific condition for trading.
The strategy then applies additional filters using RSI momentum indicators and specific candlestick patterns. It looks for a three-candle sequence with specific characteristics: a bearish first candle, a hammer or doji second candle indicating potential reversal, and a bullish third candle confirming the trend change.
Why it may be useful
This strategy provides traders with a systematic approach to capturing short-term market reversals, reducing emotional decision-making in trading. By incorporating multiple technical indicators and precise entry conditions, it offers a structured method for identifying high-probability trading opportunities with defined risk management parameters.
The approach allows traders to enter trades with clear stop-loss and target levels, enabling more disciplined and consistent trading. Its focus on the BankNifty index during specific trading hours ensures traders can leverage liquid market conditions and potentially improve their overall trading performance.
When to explore it
The strategy is most effective during the specified trading hours of 9:30 AM to 2:45 PM IST, which represent the most liquid period for the BankNifty index. Traders should use this approach when the market is experiencing a minor downtrend but showing potential signs of reversal, as indicated by specific moving average and RSI conditions.
It is particularly suitable for traders who prefer a rule-based, systematic approach to intraday trading and are comfortable with technical analysis. The strategy works best in markets with clear short-term trend dynamics and when multiple technical indicators align to signal a potential trend reversal.
Keep exploring
What we’ve verified
Access, alerts and repainting behaviour have not been independently verified for this indicator. Check the creator’s current publication and settings.
General descriptions and classifications are recovered research. Verified details above identify the specific checks we have completed. Check the creator’s current publication for later changes.


