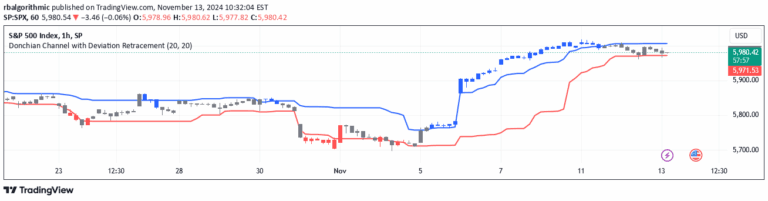
A trend reversal signal using Donchian Channels that identifies potential market direction changes by tracking price movements and channel interactions.
Explore complementary indicator rolesHow it works
The signal analyzes price movements in relation to Donchian Channels to detect potential trend reversals. When price falls with bearish candles and touches the lower channel, a bearish condition is set, which can trigger a potential bullish reversal signal when a subsequent bullish candle appears.
Similarly, when price rises with bullish candles and touches the upper channel, a bullish condition is established. This condition can lead to a potential bearish reversal signal when a subsequent bearish candle emerges, creating visual squares on the chart to indicate these potential trend changes.
Why it may be useful
This signal provides traders with a systematic approach to identifying potential trend reversals by leveraging channel dynamics and price action. By monitoring price interactions with Donchian Channels, traders can gain insights into market momentum shifts and potential entry or exit points.
The visual representation through colored squares makes it easier for traders to quickly recognize and interpret potential trend changes, reducing the complexity of manual chart analysis and helping traders make more informed trading decisions.
When to explore it
The signal is most effective in markets with clear trending behavior and sufficient price volatility. It works best in timeframes that allow for clear channel interactions, such as intraday and short-term trading scenarios where price movements are more pronounced and frequent.
Traders should use this signal in conjunction with other technical analysis tools to confirm potential trend reversals and minimize false signals. It is particularly useful in markets like stocks, forex, and cryptocurrencies where price dynamics can change rapidly.
Keep exploring
What we’ve verified
Access, alerts and repainting behaviour have not been independently verified for this indicator. Check the creator’s current publication and settings.
General descriptions and classifications are recovered research. Verified details above identify the specific checks we have completed. Check the creator’s current publication for later changes.