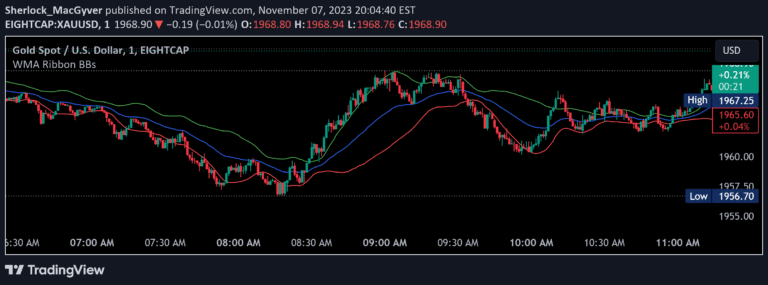
A dynamic trading indicator for S&P 500 and Nasdaq-100 futures that uses a 200-period SMA with adaptive bands to generate entry and exit signals based on price breakouts.
Explore complementary indicator rolesHow it works
The indicator calculates a Simple Moving Average (SMA) using the HL2 price over a 200-period lookback, creating a central trend line. Upper and lower bands are plotted at a 0.5% distance from this SMA, forming dynamic price channels that adapt to market volatility.
When price crosses above the upper band, a green upward triangle signals a potential long entry. Conversely, when price crosses below the lower band, a red downward triangle indicates a potential short entry. Exit signals are generated when price crosses back through these bands, with green or red squares marking the respective position closures.
Why it may be useful
This indicator provides traders with a systematic approach to identifying potential trend reversals and breakout opportunities in futures markets. By using adaptive bands around a smoothed moving average, it helps traders objectively assess market momentum and potential entry and exit points.
The method reduces emotional decision-making by offering clear, quantifiable signals based on price action relative to the dynamic trend line. Its flexibility allows traders to adjust settings to match different market conditions and personal risk tolerance.
When to explore it
The indicator is most effective during high-liquidity trading sessions, particularly the U.S. market open (9:30 AM–11:00 AM EST) and afternoon session (2:00 PM–4:00 PM EST). These periods feature strong institutional participation and significant price movements that enhance the reliability of the signals.
Traders should preferentially use this on 5-minute charts for S&P 500 and Nasdaq-100 futures, as this timeframe balances capturing meaningful price trends while avoiding excessive market noise. It is particularly useful when combined with additional confirmation tools like support/resistance levels or volume analysis.
Keep exploring
What we’ve verified
Access, alerts and repainting behaviour have not been independently verified for this indicator. Check the creator’s current publication and settings.
General descriptions and classifications are recovered research. Verified details above identify the specific checks we have completed. Check the creator’s current publication for later changes.