Linear Regression Channel
A Linear Regression Channel indicator that tracks price trends, identifies channel breakouts, and analyzes momentum direction using dynamic visual signals and customizable settings.
Explore 11,183 indicators. Filter beyond the obvious.
Discover the tools that fit the way you trade.
11,183 tools to explore
A Linear Regression Channel indicator that tracks price trends, identifies channel breakouts, and analyzes momentum direction using dynamic visual signals and customizable settings.
Fair value bands assess price behavior by tracking deviations from a mean basis, helping traders identify normal and abnormal price movements through dynamic statistical bands.
A higher timeframe trend mapping tool that visually overlays market structure, trend direction, and price boundaries onto intraday charts for enhanced trading context.
A multi-vector moving average indicator that calculates five different moving averages to assess trend alignment and momentum by comparing Hull Moving Averages with an origin ALMA moving average.
Advanced VWAP Band indicator that provides three distinct VWAP lines based on natural price points, simplifying VWAP analysis and eliminating the need for manual multiplier adjustments.
Anchored Volume-Weighted Average Price (AVWAP) indicator that calculates price levels across multiple timeframes using volume and price data for trend analysis.
A trading indicator that extends mid-lines of candles forward until price revisits the midpoint, tracking potential price action levels across different timeframes.
A dynamic trading indicator for S&P 500 and Nasdaq-100 futures that uses a 200-period SMA with adaptive bands to generate entry and exit signals based on price breakouts.
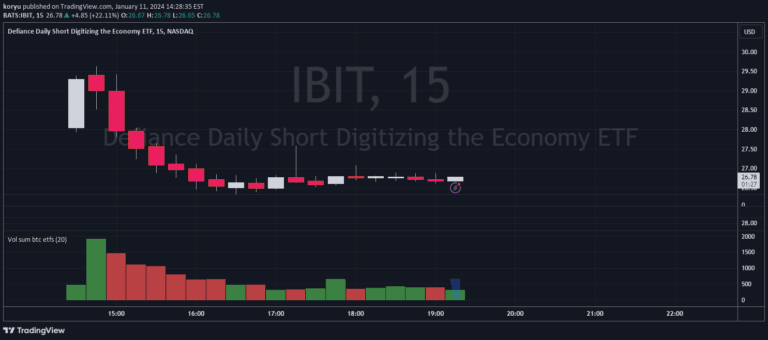
A volume indicator tracking 10 Bitcoin ETFs that calculates traded volume by multiplying shares with half-high-low price and adjusting for Bitcoin's price.
A unique volume indicator that calculates the average money traded by multiplying volume with price and creating a 25-period moving average to reveal market dynamics.
A trend reversal indicator that measures price deviation from a rolling average, providing a numerical value to help traders identify potential market turning points.
A multi-year price pattern comparison tool that overlays historical price data to help traders identify recurring market trends and potential support/resistance levels across different years.
Likes, views, and comments are historical TradingView snapshots. They describe attention, not trading performance.