
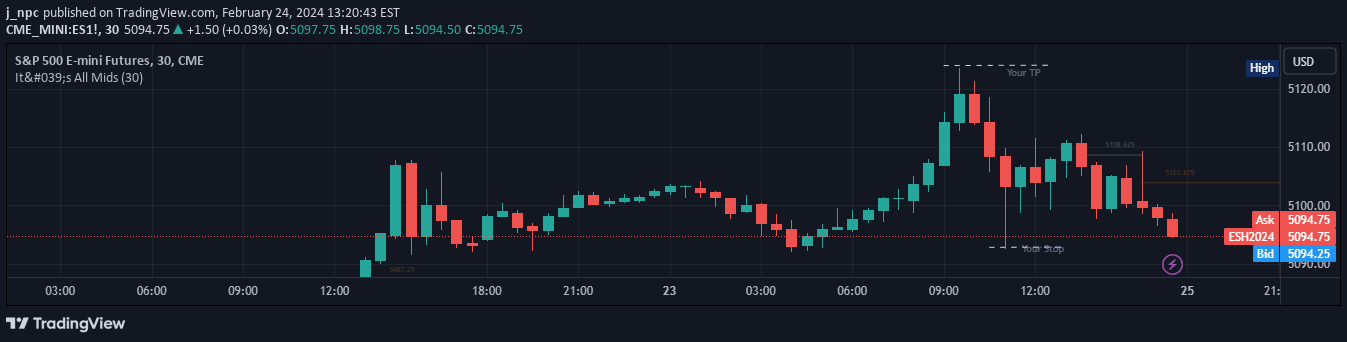
A trading indicator that extends mid-lines of candles forward until price revisits the midpoint, tracking potential price action levels across different timeframes.
Explore complementary indicator rolesHow it works
The 'It's All Mids' indicator calculates the midpoint of previous candles by averaging their high and low prices. These midpoints are then extended forward as horizontal lines on the chart, creating a visual representation of potential price levels. Each mid-line remains active until the price specifically covers or auctions through its midpoint, at which point the line is considered 'covered'.
The indicator allows flexibility in timeframe selection, permitting users to plot mid-lines from a higher timeframe onto a lower timeframe chart. This approach helps traders identify potential support and resistance levels derived from previous candle movements, providing a unique perspective on price action and potential trading opportunities.
Why it may be useful
The indicator offers traders an alternative method of identifying potential price levels beyond traditional support and resistance techniques. By tracking midpoints of previous candles, it provides a dynamic and adaptive way to visualize potential price interaction zones. This approach can help traders understand market structure and potential areas of price consolidation or reversal.
While the creator humorously disclaims its definitive trading value, the indicator presents an innovative way to map price behavior. It encourages traders to observe how prices interact with historical midpoints, potentially revealing underlying market dynamics and providing additional context for trading decisions.
When to explore it
The 'It's All Mids' indicator is most effective in markets with clear directional movements and consistent price action. It works best on timeframes that provide sufficient price detail, such as 5, 15, or 60-minute charts. Traders can use this indicator to identify potential entry and exit points by observing how price interacts with extended midpoint lines.
The signal is particularly useful for traders who want to track price levels across different timeframes and understand market structure. It can be most beneficial in futures markets like ES (E-mini S&P 500), where price action tends to be more structured and predictable. However, traders should always combine this indicator with other analytical tools and not rely on it exclusively for trading decisions.
Keep exploring
What we’ve verified
Access, alerts and repainting behaviour have not been independently verified for this indicator. Check the creator’s current publication and settings.
General descriptions and classifications are recovered research. Verified details above identify the specific checks we have completed. Check the creator’s current publication for later changes.


