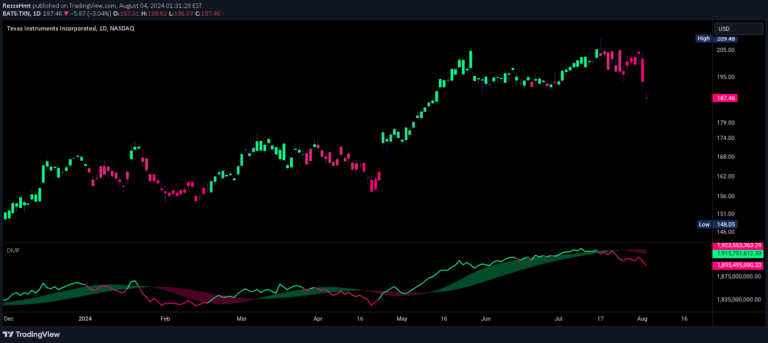
A unique volume indicator that calculates the average money traded by multiplying volume with price and creating a 25-period moving average to reveal market dynamics.
Explore complementary indicator rolesHow it works
The indicator calculates money traded by multiplying trading volume with the average price (hl2) for each trading day. It then computes a 25-period moving average of these calculated values to smooth out daily variations and provide a more consistent representation of trading activity.
By averaging the money traded, the indicator removes extreme fluctuations and creates a cleaner, more interpretable graphic. This method allows traders to see underlying trends in monetary volume that might be obscured by raw volume data, offering a more nuanced view of market participation.
Why it may be useful
Traditional volume indicators only show the number of shares traded, which can be misleading without context about the monetary value of those trades. This indicator bridges that gap by revealing the actual financial activity behind trading volume, giving traders insight into the real economic significance of market movements.
By tracking money traded, traders can identify potential accumulation and distribution zones, which are critical for understanding institutional investor behavior. This helps traders align their strategies with larger market participants and potentially anticipate trend changes before they become obvious.
When to explore it
This indicator is most effective in markets with significant institutional participation, where large funds can create meaningful volume shifts. It works best in liquid markets with consistent trading activity, such as major stock indices, popular commodities, and frequently traded currency pairs.
Traders should use this indicator in conjunction with other technical analysis tools to confirm signals and validate potential trend changes. It is particularly useful during periods of market consolidation or when seeking to understand the underlying strength of a current price trend.
Keep exploring
What we’ve verified
Access, alerts and repainting behaviour have not been independently verified for this indicator. Check the creator’s current publication and settings.
General descriptions and classifications are recovered research. Verified details above identify the specific checks we have completed. Check the creator’s current publication for later changes.