
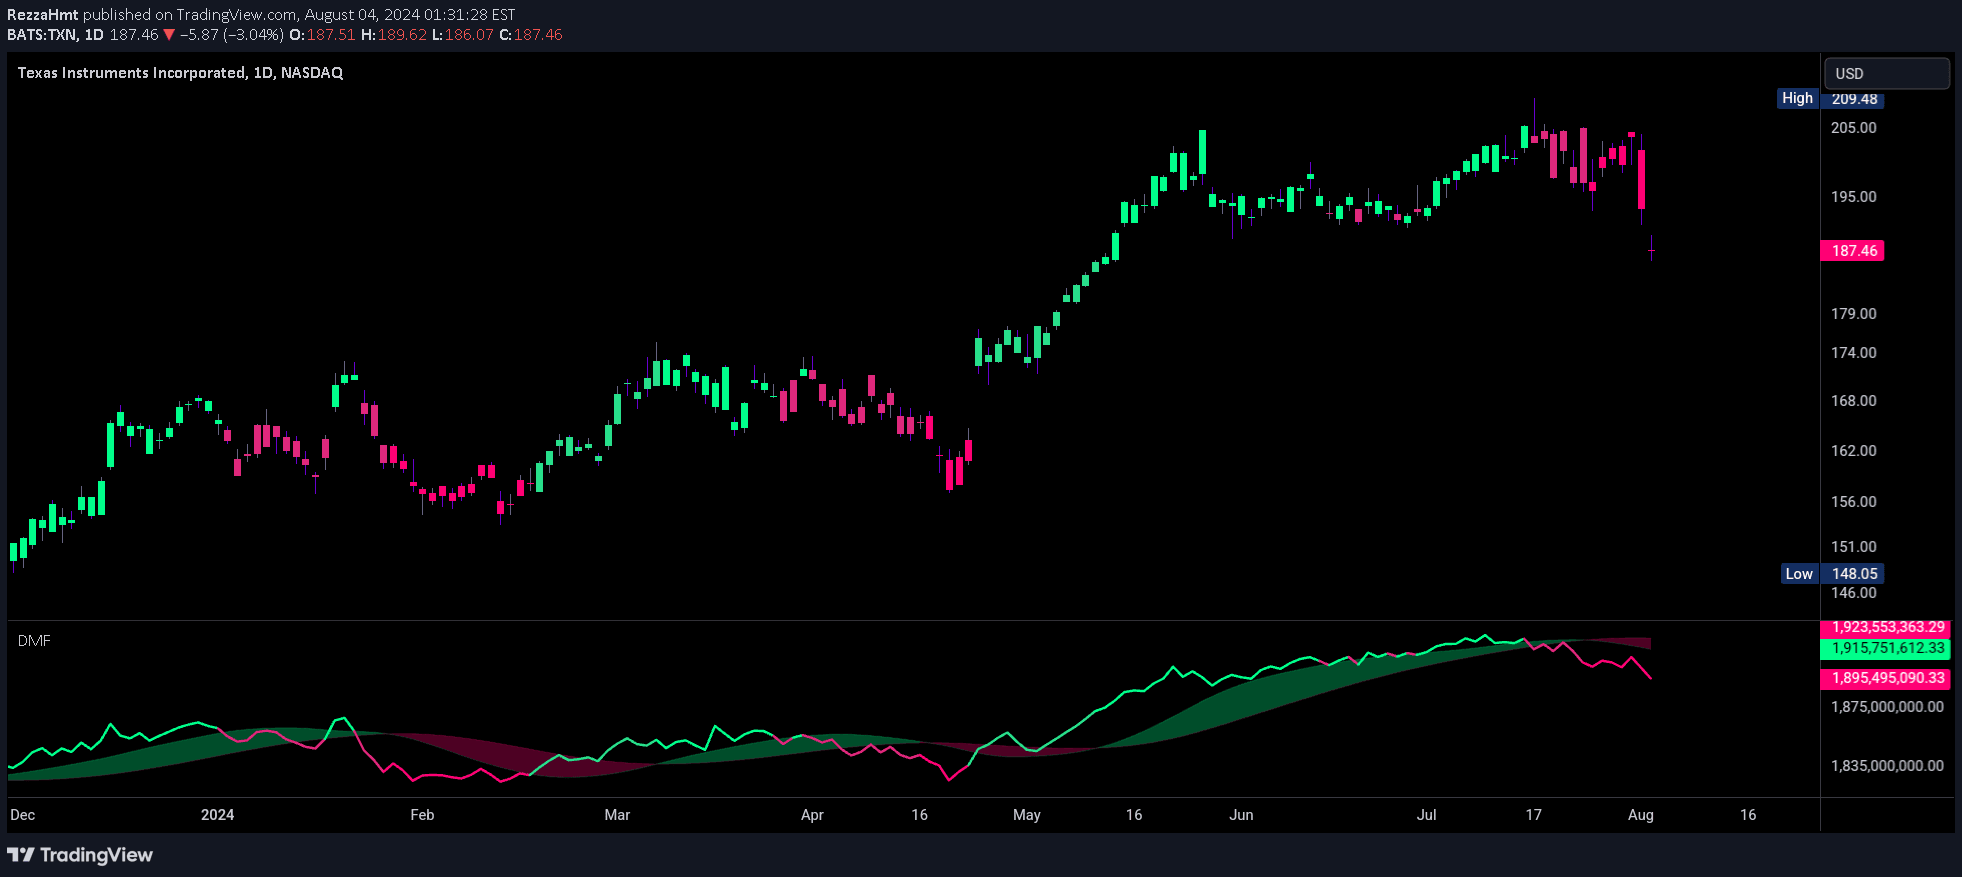
Dynamic Money Flow is an advanced volume indicator that enhances traditional money flow analysis by incorporating true range and close price movements to provide more accurate trend and volume insights.
Explore complementary indicator rolesHow it works
Dynamic Money Flow improves upon traditional money flow indicators by incorporating true range and close price comparisons. It calculates volume flow by comparing close prices to price ranges and using true accumulation/distribution methods. The indicator uses exponential averaging to reduce the impact of sudden data drops.
It compares the flowing volume against total volume, creating a more nuanced representation of money movement in the market. The calculation includes both close-to-range and close-to-close price comparisons. This multi-dimensional approach helps traders understand volume dynamics more comprehensively
Why it may be useful
Dynamic Money Flow provides traders with a more sophisticated understanding of volume and price movements. By addressing limitations in traditional money flow indicators, it offers more accurate signals for trend confirmation and potential reversals.
The indicator helps traders identify subtle volume shifts that might be missed by simpler methods. Its improved calculation methodology reduces the impact of random data fluctuations. Traders can use it to validate breakouts, assess trend strength, and make more informed trading decisions. The indicator bridges gaps in traditional volume analysis
When to explore it
Dynamic Money Flow works best during trending markets with clear directional movements. It is particularly useful for swing traders and day traders seeking confirmation of trend strength and potential reversals. The indicator is most effective when used alongside other technical analysis tools like support/resistance levels and price action patterns.
Traders should pay special attention to zero line crosses and potential divergences. It performs well in markets with significant volume changes and when tracking institutional money flow. Applying it across multiple timeframes can provide comprehensive market insights
Keep exploring
What we’ve verified
Access, alerts and repainting behaviour have not been independently verified for this indicator. Check the creator’s current publication and settings.
General descriptions and classifications are recovered research. Verified details above identify the specific checks we have completed. Check the creator’s current publication for later changes.




