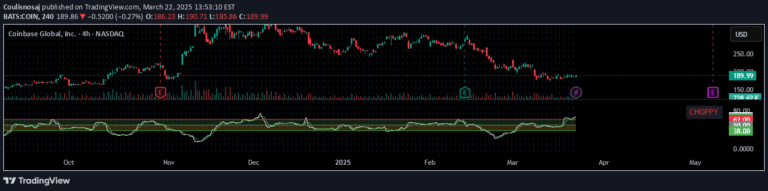
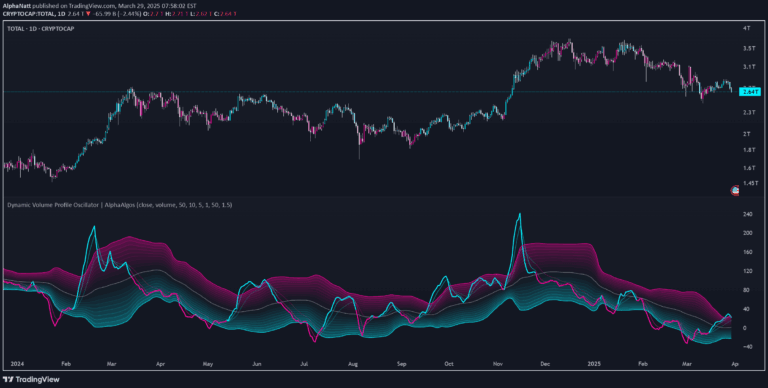
A Donchian Channel trading strategy that uses price retracements within channel boundaries to identify strategic exit points and capture market momentum through color-coded signals.
Explore complementary indicator rolesHow it works
The Donchian Channel creates a dynamic price range by plotting the highest high and lowest low over a specified period, forming upper and lower channel boundaries. Traders monitor price movements within these boundaries, identifying potential entry and exit points based on retracements and momentum shifts.
When prices approach or break these channel boundaries, the indicator generates color-coded signals: blue indicates a potential long position, while red signals a potential short position. This systematic approach allows traders to track price behavior, recognize trend changes, and make informed trading decisions based on the channel's dynamic range.
Why it may be useful
The Donchian Channel provides traders with a structured method to understand market dynamics by visualizing price volatility and momentum through a clear, easy-to-interpret channel framework. By mapping the highest highs and lowest lows, traders gain insights into potential trend reversals and price movement ranges, which can help in making more strategic trading decisions.
The color-coded signaling system enhances decision-making by quickly communicating potential market conditions, allowing traders to respond swiftly to changing trends. This approach minimizes emotional trading and provides a data-driven methodology for managing risk and identifying opportune moments to enter or exit trades.
When to explore it
The Donchian Channel is most effective in markets with clear trending behavior, where price movements demonstrate consistent directional momentum. It works particularly well in markets with moderate to high volatility, where price ranges are dynamic and provide multiple opportunities for strategic entry and exit points.
Traders should consider using this indicator during periods of significant market activity, such as during major economic announcements, earnings reports, or when trading instruments with inherent volatility. It is especially valuable for traders seeking a systematic approach to capturing trend movements and managing risk through a visual, easily interpretable framework.
Keep exploring
What we’ve verified
Access, alerts and repainting behaviour have not been independently verified for this indicator. Check the creator’s current publication and settings.
General descriptions and classifications are recovered research. Verified details above identify the specific checks we have completed. Check the creator’s current publication for later changes.