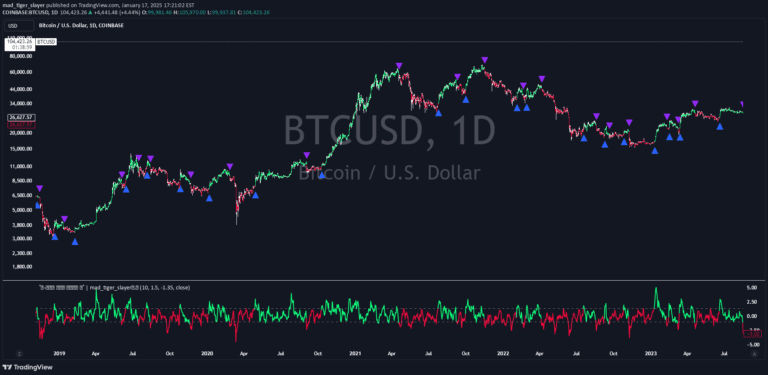
RTI Thresholds Index | mad_tiger_slayer
The RTI Threshold Indicator tracks market trend strength by comparing price to dynamic trend boundaries, helping traders identify long-term trend conditions and potential entry/exit points.
Explore 11,183 indicators. Filter beyond the obvious.
Discover the tools that fit the way you trade.
11,183 tools to explore
The RTI Threshold Indicator tracks market trend strength by comparing price to dynamic trend boundaries, helping traders identify long-term trend conditions and potential entry/exit points.
A fast and responsive oscillator designed to capture quick price movements by comparing price deviation from moving averages to Average True Range, providing rapid market trend identification.
A volume-weighted Hull Moving Average indicator that enhances trading signals by integrating volume data to detect trend direction and potential entry/exit points with improved accuracy.
A multi-indicator trend analysis tool that aggregates signals from RSI, SMA, EMA, and RMA to provide a comprehensive market direction assessment.
A custom TradingView indicator that enhances RSI by incorporating SMA and standard deviation bands to provide clearer trend signals and market analysis for swing traders.
Likes, views, and comments are historical TradingView snapshots. They describe attention, not trading performance.