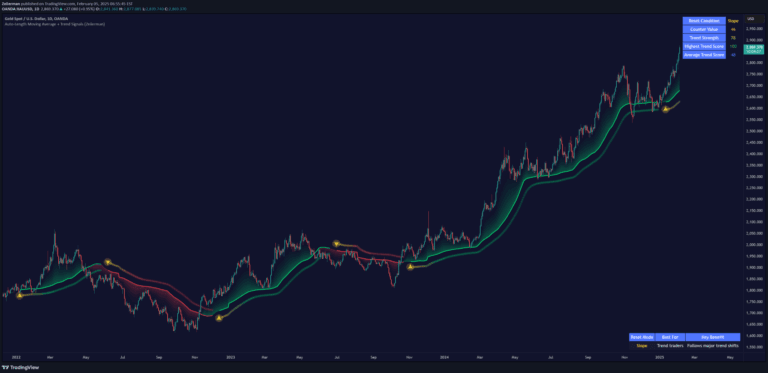
A volume-weighted Hull Moving Average indicator that enhances trading signals by integrating volume data to detect trend direction and potential entry/exit points with improved accuracy.
Explore complementary indicator rolesHow it works
The Volume Weighted HMA Index calculates a Hull Moving Average by incorporating volume data, which amplifies the influence of high-volume price changes. It dynamically adjusts the moving average calculation to prioritize periods of significant market activity, creating a more responsive trend indicator.
The indicator identifies trend direction through crossovers with zero, generating bullish signals when crossing above and bearish signals when crossing below. By weighting price changes with volume, the indicator provides a more nuanced view of market momentum and potential trend shifts.
Why it may be useful
Traders benefit from this indicator's ability to filter out noise and focus on more meaningful price movements by integrating volume data into the trend analysis. The volume-weighted approach helps reduce false signals that can occur with traditional moving average calculations, providing a more robust method of trend identification.
By combining volume and price momentum, the indicator offers traders a more comprehensive tool for understanding market dynamics. It helps traders make more informed decisions by highlighting periods of significant market activity and providing clear visual cues about potential trend changes.
When to explore it
The Volume Weighted HMA Index works best in markets with consistent volume data and clear trending characteristics. It is particularly effective for traders looking to identify early trend shifts and confirm potential entry and exit points across various timeframes and asset classes.
Traders should pair this indicator with other technical analysis tools to validate signals and create more comprehensive trading strategies. It is most powerful when used in conjunction with additional confirmation indicators and within a robust risk management framework.
Keep exploring
What we’ve verified
Access, alerts and repainting behaviour have not been independently verified for this indicator. Check the creator’s current publication and settings.
General descriptions and classifications are recovered research. Verified details above identify the specific checks we have completed. Check the creator’s current publication for later changes.