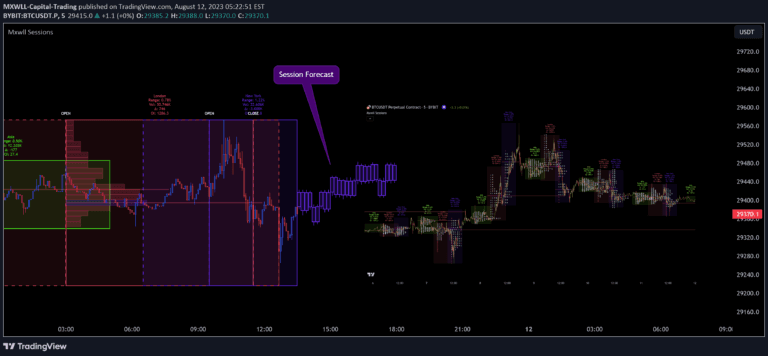
A multi-component trading indicator that tracks cumulative gains and losses, calculates standard deviation levels, and provides normalized volume analysis for comprehensive market insights.
Explore complementary indicator rolesHow it works
This trading indicator begins by allowing users to select a basis for calculation, including Price, VIX, VVIX, or MOVE index. It then computes cumulative gain and loss percentages by tracking changes in the selected basis data, separately aggregating positive and negative movements to create a comprehensive trend analysis.
The script further enhances analysis by calculating standard deviation levels for the cumulative gain/loss data. Two specific levels are determined: a positive standard deviation level representing upper gain thresholds and a negative standard deviation level representing lower loss thresholds. Additionally, the indicator normalizes trading volume on a reversed -5 to 5 scale, providing a unique perspective on market activity.
Why it may be useful
This indicator provides traders with a multifaceted approach to market analysis by combining trend, volatility, and volume insights in a single tool. By tracking cumulative gains and losses, it offers a nuanced view of market momentum that goes beyond simple price movement, helping traders understand underlying market dynamics and potential trend reversals.
The normalized volume and standard deviation levels add critical context to price movements, allowing traders to gauge market sentiment and potential extreme conditions. These additional layers of analysis help traders make more informed decisions by providing a more comprehensive understanding of market behavior beyond traditional single-metric indicators.
When to explore it
This indicator is most effective in markets with clear trending characteristics, where cumulative gains and losses can provide meaningful insights into market direction. It works particularly well in volatile markets where standard deviation levels can help identify potential overbought or oversold conditions, offering traders opportunities to enter or exit positions strategically.
The tool is especially useful for traders seeking a comprehensive market analysis tool that combines multiple analytical perspectives. It is particularly valuable during periods of market uncertainty, when traders need a nuanced understanding of trend strength, volume dynamics, and potential reversal points across different timeframes and market conditions.
Keep exploring
What we’ve verified
Access, alerts and repainting behaviour have not been independently verified for this indicator. Check the creator’s current publication and settings.
General descriptions and classifications are recovered research. Verified details above identify the specific checks we have completed. Check the creator’s current publication for later changes.