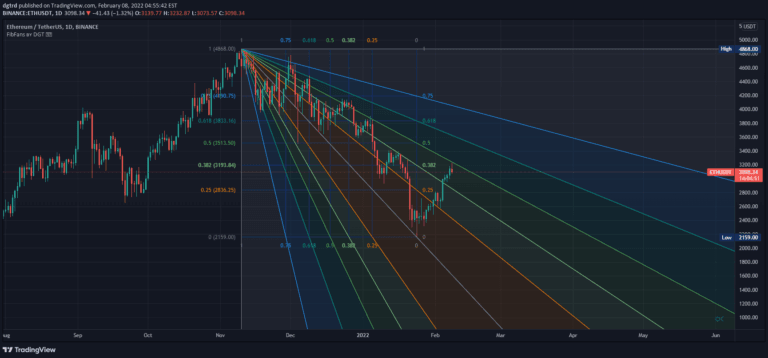
A TradingView Pine Script tool that dynamically identifies Fibonacci retracement levels using ZigZag price movements, helping traders pinpoint potential support and resistance zones.
Explore complementary indicator rolesHow it works
The Fibonacci - DolphinTradeBot indicator uses a zigzag formation to track significant price swings and identify key retracement levels. It analyzes price movements by detecting bullish and bearish structures, marked by specific high and low point sequences. The tool calculates Fibonacci levels at the beginning and end points of major swing movements.
It automatically plots classic Fibonacci levels including 0, 0.236, 0.382, 0. 5, 0.618, 0.786, and 1.0 on the chart. Traders can customize pivot periods and zigzag settings to suit their trading style. The indicator provides visual markers like a ' ' for level determination and a '❌' when price closes outside these levels
Why it may be useful
Fibonacci retracement levels are crucial for traders seeking to understand potential price reversals and trend continuation points. This indicator simplifies the complex process of manually drawing Fibonacci levels by automating the detection and plotting. By providing clear visual representations of key support and resistance zones, traders can make more informed decisions about entry and exit points.
The tool helps identify potential price reversal areas, which can be critical for risk management and trade planning. It offers flexibility through customizable settings, allowing traders to adapt the indicator to different market conditions and trading strategies
When to explore it
The Fibonacci - DolphinTradeBot works best during trending markets with clear directional movements. It is particularly useful for swing traders and day traders looking to identify potential support and resistance levels. Traders should apply this indicator after significant price movements or during periods of market consolidation.
It is most effective when combined with other technical analysis tools to confirm signals. The indicator is suitable for various financial instruments, including stocks, forex, and cryptocurrencies. Traders can adjust settings to match different market volatilities and timeframes, making it adaptable to various trading styles and market conditions
Keep exploring
What we’ve verified
Access, alerts and repainting behaviour have not been independently verified for this indicator. Check the creator’s current publication and settings.
General descriptions and classifications are recovered research. Verified details above identify the specific checks we have completed. Check the creator’s current publication for later changes.