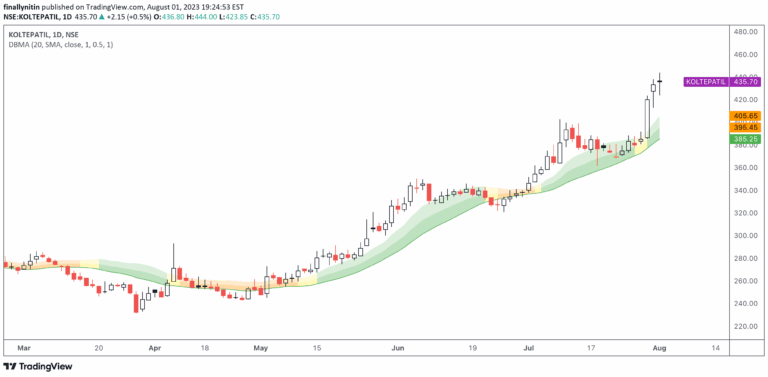
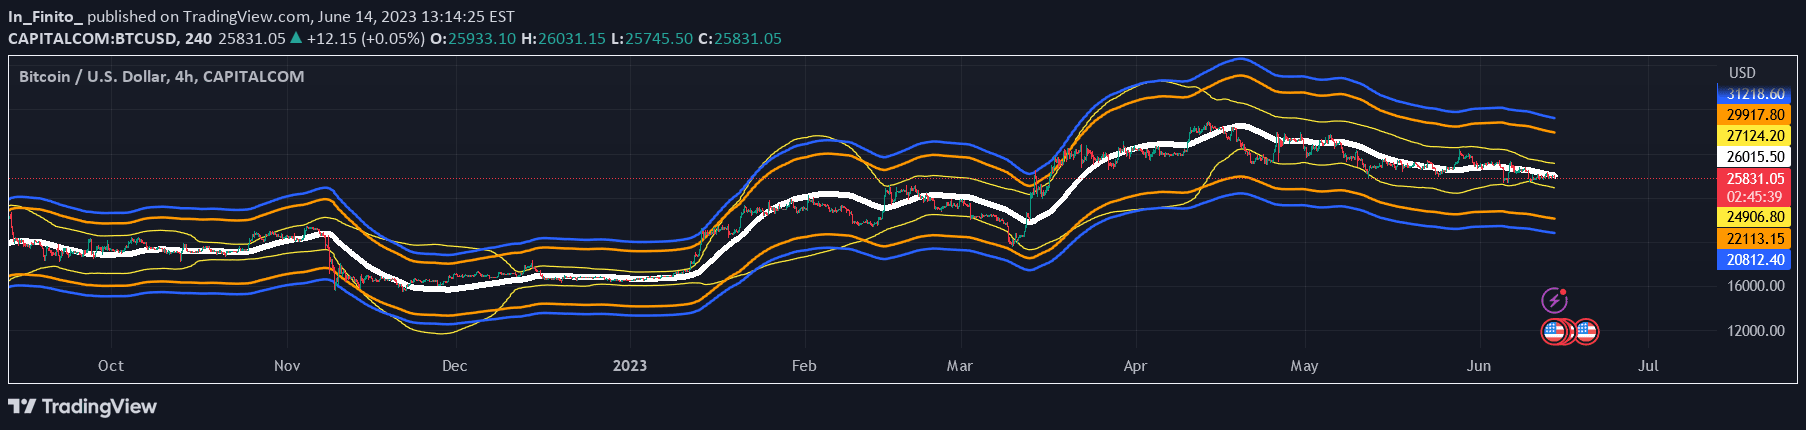
The APRMA is a dynamic moving average indicator with adjustable percentage bands that help traders analyze price trends, volatility, and potential overbought or oversold conditions.
Explore complementary indicator rolesHow it works
The Adjustable Percentage Range Moving Average (APRMA) starts by calculating a moving average of price over a specified number of periods, which serves as the central baseline. Around this central line, four bands are created at user-defined percentage distances, expanding and contracting based on the trader's input settings.
These percentage bands provide a flexible framework for visualizing price movement relative to the average. As the price moves closer to or beyond these bands, traders can quickly interpret potential trend strength, overbought or oversold conditions, and current market volatility without relying on standard deviation calculations.
Why it may be useful
The APRMA offers traders a highly customizable tool for understanding market dynamics that adapts to different trading styles and asset characteristics. By allowing precise percentage adjustments, it provides more nuanced insights than traditional moving average indicators, enabling traders to set sensitivity levels matching specific market conditions.
This flexibility makes the APRMA valuable for identifying trend confirmations, potential reversion points, and breakout signals across various timeframes and asset classes. Traders can quickly gauge market momentum and make more informed decisions about entry and exit points based on the indicator's visual representation.
When to explore it
The APRMA works best in markets with clear trending behaviors or significant price movements where volatility tracking is crucial. It is particularly effective in assets that demonstrate consistent directional moves, such as major currency pairs, popular stocks, or commodities with predictable trading patterns.
Traders should consider using the APRMA during periods of moderate to high market activity, where price fluctuations provide meaningful signals. The indicator is especially useful when combined with other technical analysis tools to confirm trends, validate potential reversals, and identify potential breakout opportunities across different trading timeframes.
Keep exploring
What we’ve verified
Access, alerts and repainting behaviour have not been independently verified for this indicator. Check the creator’s current publication and settings.
General descriptions and classifications are recovered research. Verified details above identify the specific checks we have completed. Check the creator’s current publication for later changes.