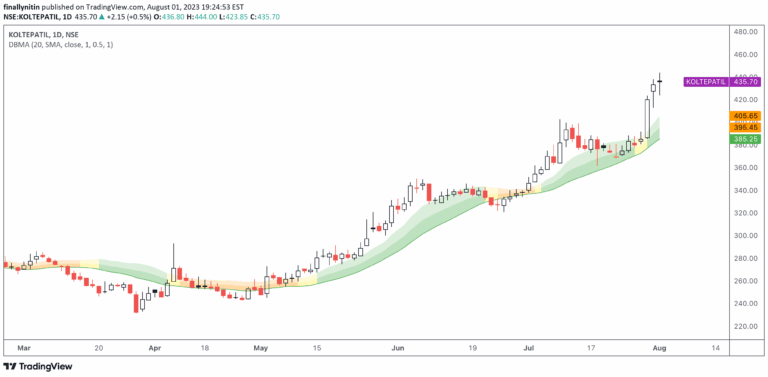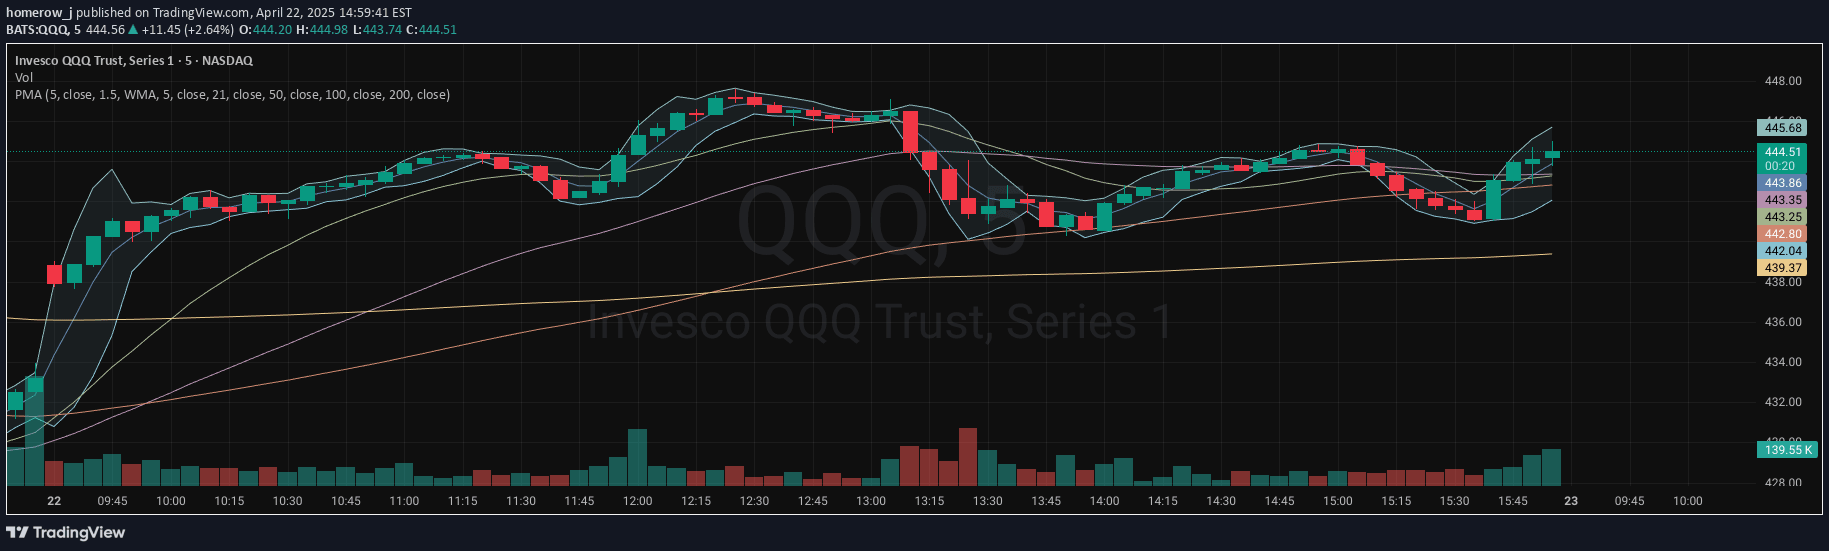
A comprehensive trading indicator combining Bollinger Bands with multiple weighted moving averages (WMA) at different time lengths to provide flexible trend and volatility analysis.
Explore complementary indicator rolesHow it works
This indicator integrates Bollinger Bands with a 5-day Weighted Moving Average (WMA) and additional standard moving averages at 21, 50, 100, and 200-day intervals. The WMA method provides more weight to recent price data, creating a responsive trend analysis tool that adapts quickly to market changes.
By combining multiple moving averages with Bollinger Bands, the indicator offers a comprehensive view of price movements, trend direction, and potential volatility. The flexible configuration allows traders to customize length and averaging methods to suit their specific trading strategy and market analysis preferences.
Why it may be useful
Traders benefit from this indicator's multi-layered approach to market analysis, which provides a more nuanced understanding of price trends and potential market movements. The combination of Bollinger Bands and multiple moving averages allows for more robust trend identification and potential entry/exit point recognition.
The customizable nature of the indicator makes it adaptable to different trading styles and market conditions. By offering multiple time frames and averaging methods, traders can fine-tune their analysis and potentially improve their decision-making process across various financial instruments.
When to explore it
This indicator is most effective in markets with clear trending characteristics, where multiple moving averages can help confirm trend strength and direction. It works particularly well in liquid markets with consistent price movements, such as major forex pairs, large-cap stocks, and significant index components.
Traders should use this indicator during periods of moderate to high market volatility, where the combination of Bollinger Bands and moving averages can provide clear signals about potential trend reversals or continuation. It is especially useful when combined with other technical analysis tools to validate trading decisions.
Keep exploring
What we’ve verified
Access, alerts and repainting behaviour have not been independently verified for this indicator. Check the creator’s current publication and settings.
General descriptions and classifications are recovered research. Verified details above identify the specific checks we have completed. Check the creator’s current publication for later changes.