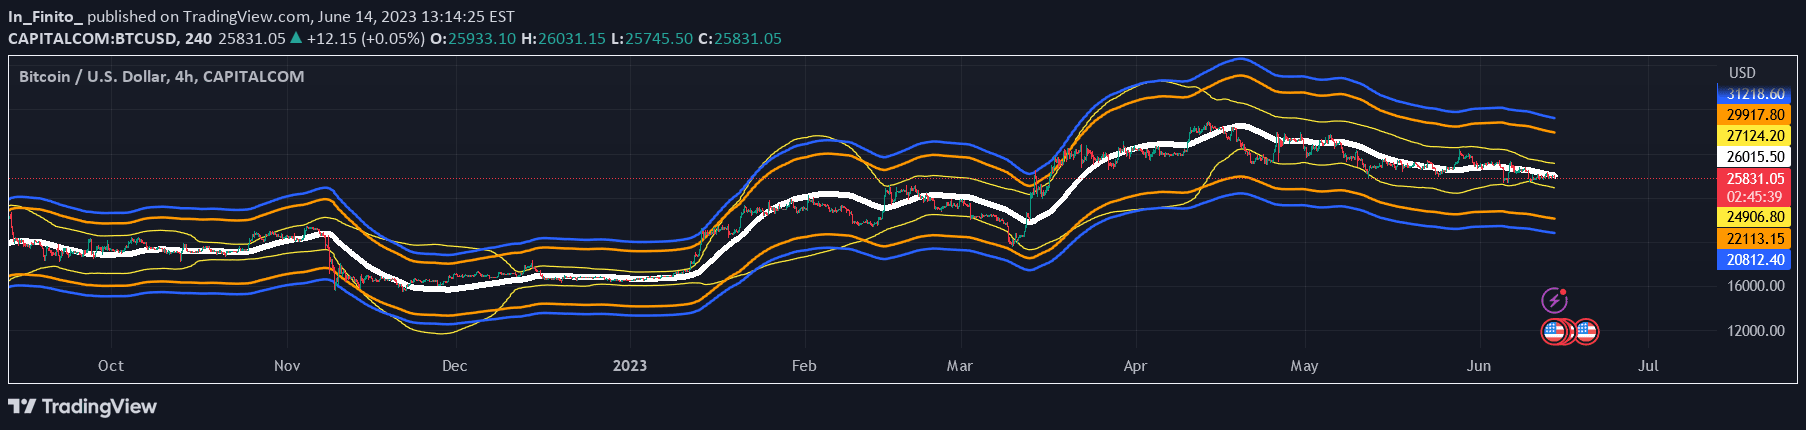
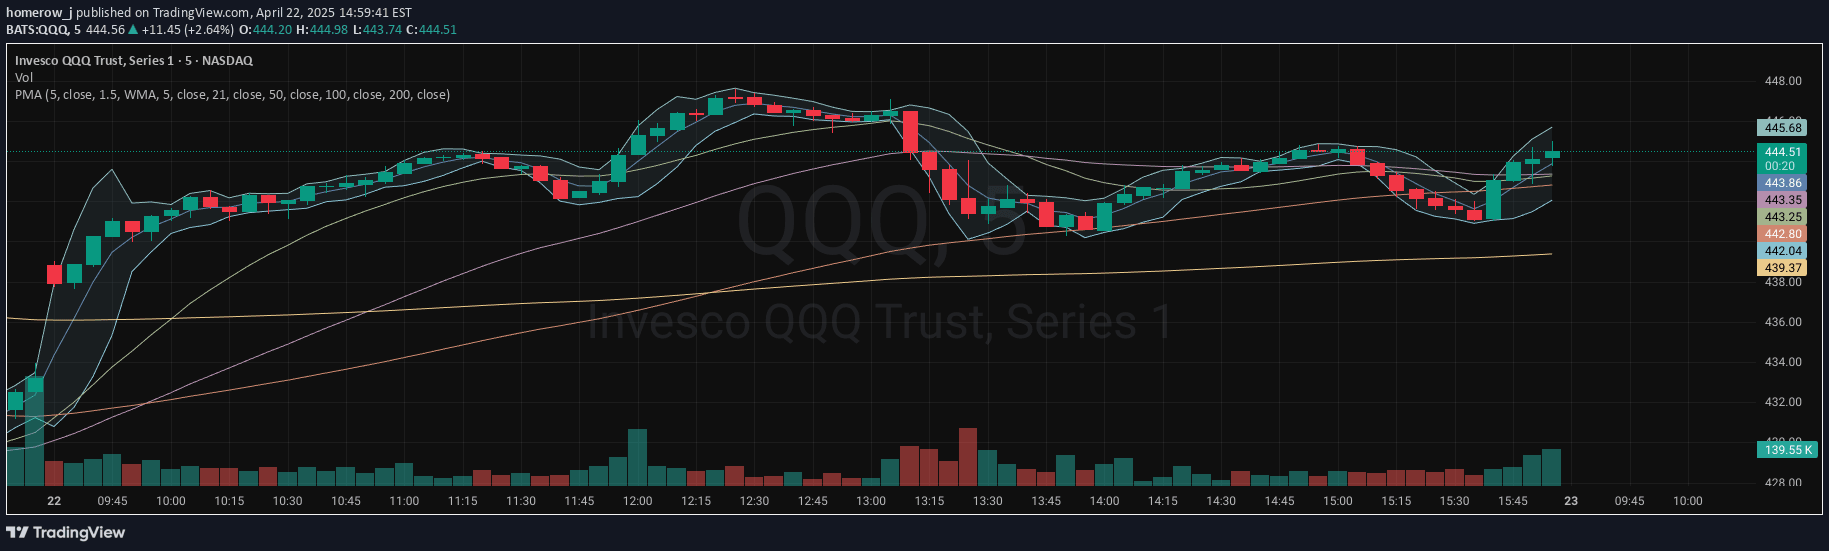
A comprehensive trading indicator combining multiple moving averages, Bollinger Bands, and rolling Volume Weighted Average Price to analyze price trends, momentum, and market volatility.
Explore complementary indicator rolesHow it works
The indicator integrates multiple moving average types and lengths across different timeframes to create a comprehensive price analysis tool. It calculates moving averages using various mathematical methods like Simple, Exponential, Weighted, and Hull, allowing traders to customize their analysis based on specific market conditions and trading preferences.
Simultaneously, the indicator overlays Bollinger Bands to measure price volatility and a rolling Volume Weighted Average Price (VWAP) that adapts to different chart timeframes. By combining these technical analysis components, traders can gain deeper insights into price trends, momentum, and potential support and resistance levels.
Why it may be useful
This multi-dimensional indicator provides traders with a sophisticated approach to market analysis by synthesizing multiple technical indicators into a single, customizable tool. It helps traders understand price momentum, volatility, and trend strength more comprehensively than single-indicator approaches, enabling more informed trading decisions.
By offering flexibility in moving average types, lengths, and timeframes, the indicator allows traders to adapt their analysis to different market conditions and personal trading strategies. The integrated Bollinger Bands and rolling VWAP further enhance the analytical depth, providing additional context for price movements and potential trading opportunities.
When to explore it
The indicator is most effective in markets with clear trending characteristics, where price movement shows consistent directional momentum across multiple timeframes. It works particularly well in liquid markets with sufficient trading volume, such as major forex pairs, large-cap stocks, and prominent cryptocurrency pairs.
Traders should utilize this indicator during periods of moderate to high market volatility, where multiple technical analysis methods can provide more robust insights. It is especially useful when transitioning between different market conditions, helping traders identify potential trend reversals, confirm existing trends, and spot emerging trading opportunities.
Keep exploring
What we’ve verified
Access, alerts and repainting behaviour have not been independently verified for this indicator. Check the creator’s current publication and settings.
General descriptions and classifications are recovered research. Verified details above identify the specific checks we have completed. Check the creator’s current publication for later changes.