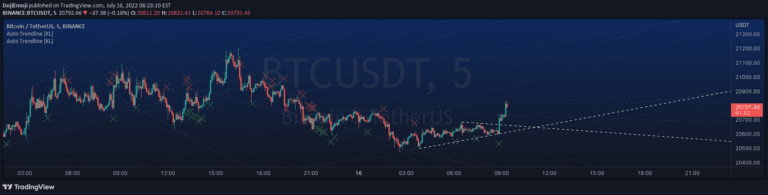
ICT Killzones + Pivots [TFO]
A customizable trading indicator designed to identify ICT Killzones and track high and low price pivots during specific market sessions with configurable time windows.
Explore 11,183 indicators. Filter beyond the obvious.
Discover the tools that fit the way you trade.
11,183 tools to explore
A customizable trading indicator designed to identify ICT Killzones and track high and low price pivots during specific market sessions with configurable time windows.
A trading indicator that identifies breaker blocks and highlights potential entry points by detecting price action around support and resistance zones with premium/discount swing levels.
A universal strategy template for TradingView that allows traders to convert any indicator into a tradable strategy with comprehensive risk management and backtesting features.
An advanced pattern recognition indicator that identifies ABC chart patterns using trend cloud, ZigZag, and Fibonacci levels to detect potential trading opportunities with customizable settings.
A market structure indicator using fractal patterns to detect trend changes, support/resistance levels, and market reversals with adaptive analysis of price movements.
A comprehensive technical analysis tool that uses linear regression to plot channels, bands, and future price projections, helping traders identify trends, potential reversals, and market dynamics.
A trading indicator that calculates volume delta and open interest delta, providing insights into market sentiment and trading activity across different price levels and asset types.
An automated tool that systematically draws trend lines by connecting recent fractals, helping traders identify potential price action patterns without subjective manual drawing.
A multi-timeframe support and resistance indicator that identifies key price zones, tracks breaks and retests, and provides comprehensive market trend analysis for traders.
A Fibonacci-based indicator that creates dynamic trading channels and levels using swing highs and lows, helping traders identify potential support, resistance, and trend reversal points.
A trading toolkit focused on identifying market trends and reversals with flexible detection modes and risk management strategies for precise entry and exit points.
An indicator that identifies divergences between swing points of a chart symbol and two external tickers, providing statistical insights into price behavior correlation.
Likes, views, and comments are historical TradingView snapshots. They describe attention, not trading performance.