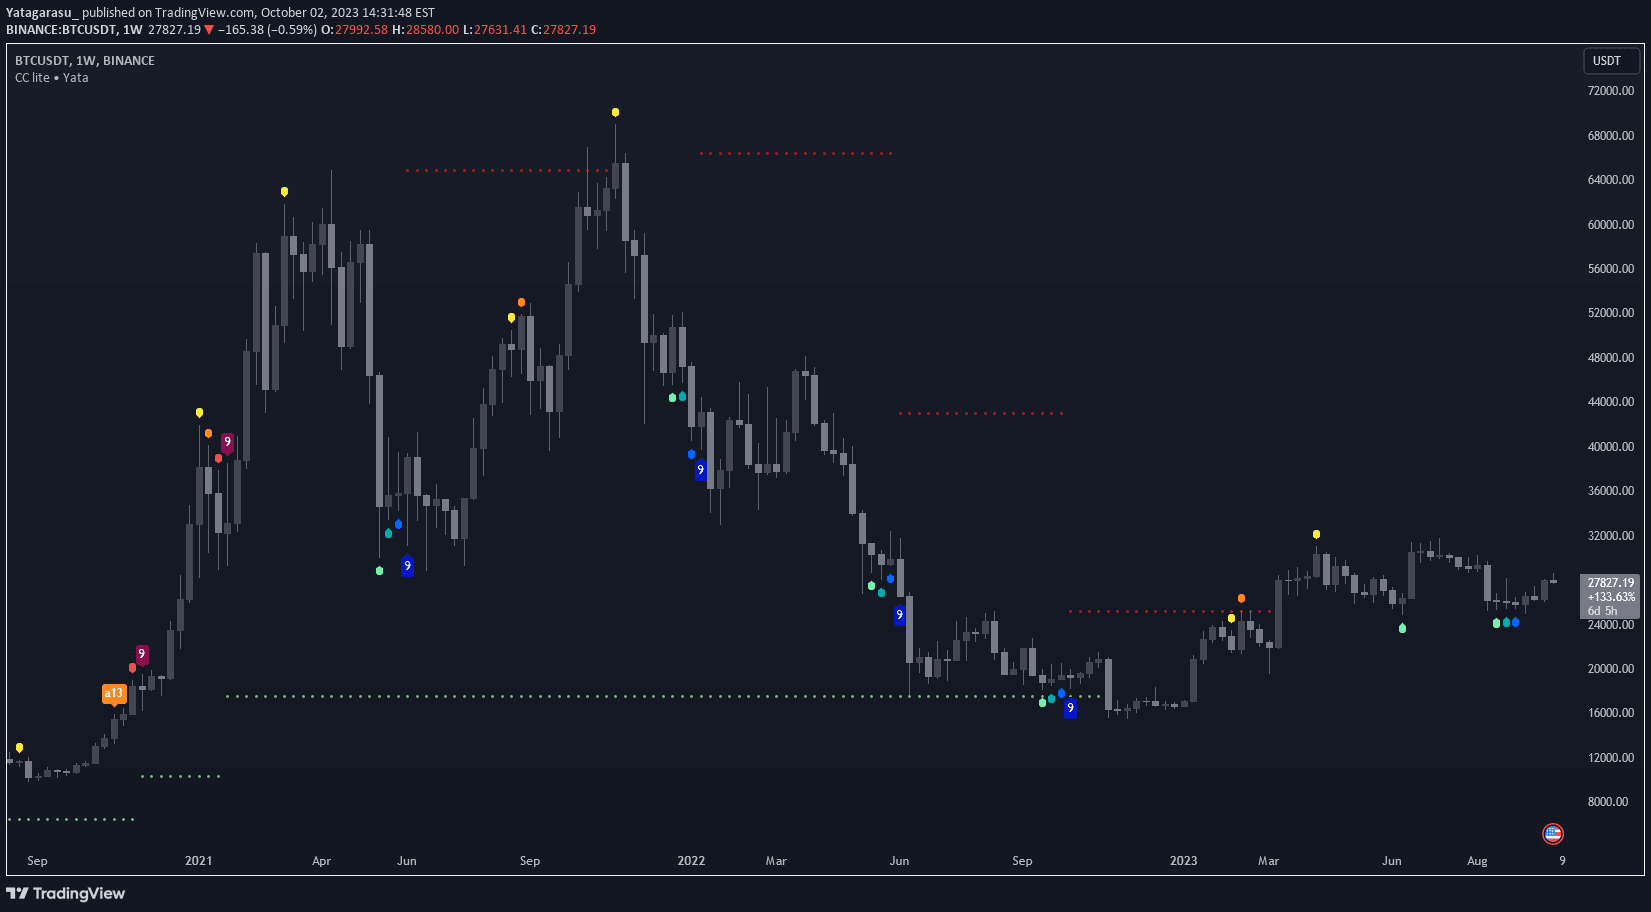
Consecutive Candles | Multi Timeframe
A trading signal that identifies potential turning points in asset prices by highlighting support and resistance levels with customizable display options.
Explore 11,183 indicators. Filter beyond the obvious.
Discover the tools that fit the way you trade.
11,183 tools to explore
A trading signal that identifies potential turning points in asset prices by highlighting support and resistance levels with customizable display options.
A multi-pivot indicator that displays support and resistance levels using various pivot calculation methods and previous period price levels for comprehensive market analysis.
A trading signal that identifies potential turning points in asset prices by displaying configurable numbers and tracking support and resistance levels for trend analysis.
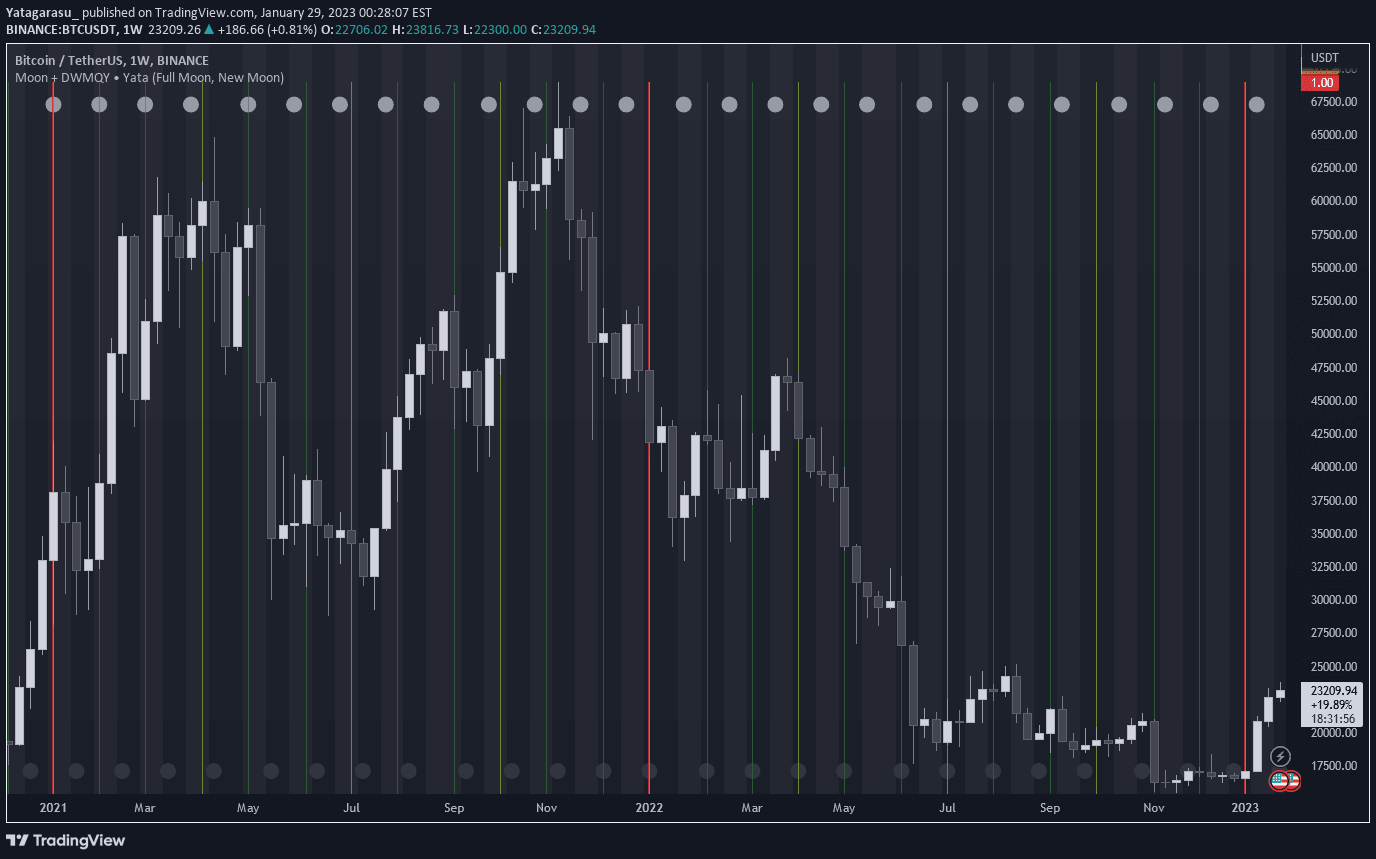
A trading strategy exploring potential correlations between moon phases and market movements, coupled with period break identification for market cycle analysis.
A comprehensive trading indicator combining multiple moving averages, Bollinger Bands, and rolling Volume Weighted Average Price to analyze price trends, momentum, and market volatility.
Likes, views, and comments are historical TradingView snapshots. They describe attention, not trading performance.