
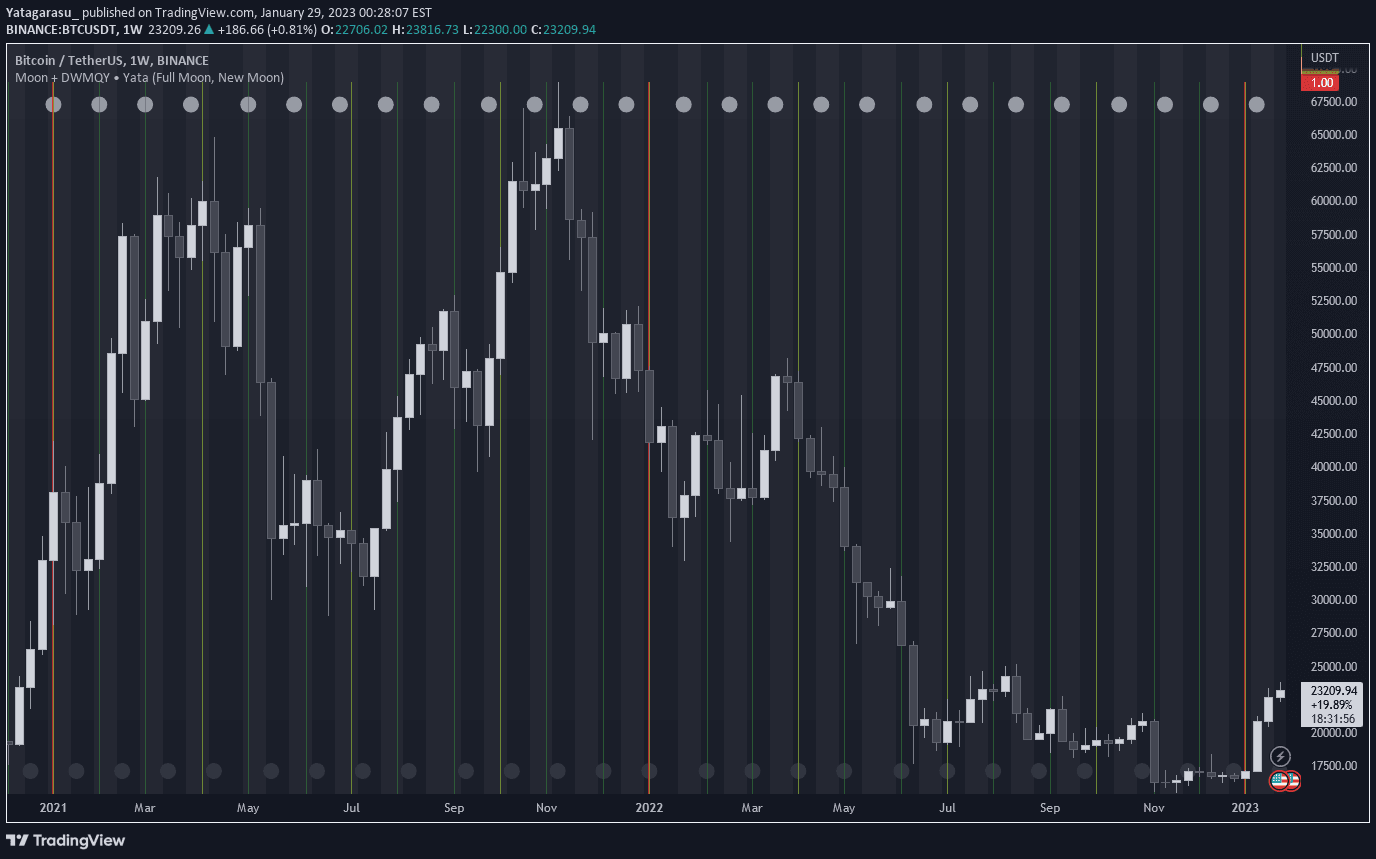
A trading strategy exploring potential correlations between moon phases and market movements, coupled with period break identification for market cycle analysis.
Explore complementary indicator rolesHow it works
The moon phases strategy estimates lunar cycles using a periodic model with a 29.530588853-day cycle, tracking the moon's potential influence on market behavior. It generates trading signals based on different moon phase methodologies, providing traders with unique insights into potential market movements.
Additionally, the strategy incorporates period break indicators that mark the start of daily, weekly, monthly, quarterly, and yearly sessions. These vertical lines help traders identify and analyze market cycles, offering visual cues about potential transition points and cyclical patterns in price action.
Why it may be useful
Moon phase trading offers an alternative perspective on market movements, leveraging astronomical cycles to potentially predict or understand market sentiment and behavior. By recognizing potential correlations between lunar cycles and financial markets, traders can develop unique strategies that differ from traditional technical analysis approaches.
The period break indicators provide crucial visual context for market cycles, helping traders understand broader temporal patterns and transitions. These markers can assist in recognizing potential trend changes, planning entry and exit points, and developing a more comprehensive view of market dynamics across different timeframes.
When to explore it
This strategy is most effective when used on higher timeframes where lunar cycle approximations become more reliable and less subject to short-term fluctuations. Traders should consider using it in conjunction with other technical indicators to confirm signals and validate potential trading opportunities.
The period break indicators are particularly useful for longer-term traders and investors who want to understand market cycles and identify potential trend transitions. They can be especially valuable for swing traders and investors looking to align their strategies with broader market rhythms and cyclical patterns.
Keep exploring
What we’ve verified
Access, alerts and repainting behaviour have not been independently verified for this indicator. Check the creator’s current publication and settings.
General descriptions and classifications are recovered research. Verified details above identify the specific checks we have completed. Check the creator’s current publication for later changes.





