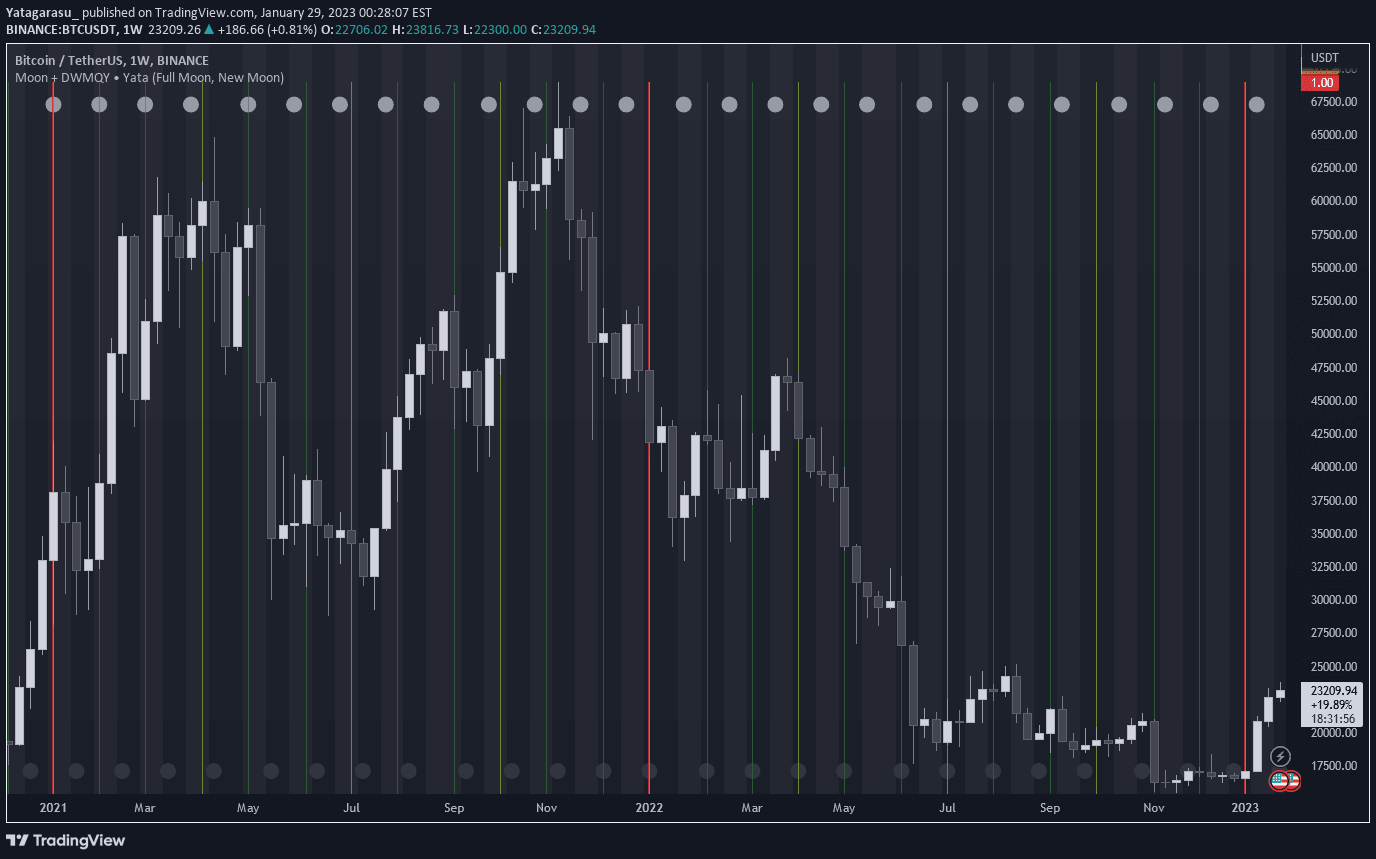
An intraday time-based range indicator that calculates average open, high, and low prices for recent trading sessions, helping traders identify fair value and potential market movements.
Explore complementary indicator rolesHow it works
The indicator allows users to specify an intraday time-based range and calculates the average open, high, and low prices for that specific trading session. It plots the five most recent sessions directly on the chart, providing a visual representation of price dynamics.
By tracking these averages, traders can quickly assess the current price position relative to historical session ranges. The visual overlay helps identify potential trends, consolidations, and fair value zones that might not be immediately apparent from raw price action alone.
Why it may be useful
This indicator provides traders with a quick and intuitive method to understand recent market behavior and potential price movements. By displaying average prices across multiple recent sessions, it offers a condensed view of market sentiment and potential support or resistance levels.
The visual representation allows traders to make faster, more informed decisions by quickly comparing current price levels with recent session averages. It helps identify potential entry and exit points by highlighting when price is diverging from or converging with recent session ranges.
When to explore it
The indicator is most effective during active trading sessions with consistent market participation and clear price movements. It works particularly well in markets with identifiable intraday trends and relatively stable trading volumes.
Traders should use this signal when seeking to understand short-term price dynamics, identify potential trend reversals, or assess market sentiment within a specific timeframe. It is especially useful for day traders and scalpers who need rapid, visual insights into recent market behavior.
Keep exploring
What we’ve verified
Access, alerts and repainting behaviour have not been independently verified for this indicator. Check the creator’s current publication and settings.
General descriptions and classifications are recovered research. Verified details above identify the specific checks we have completed. Check the creator’s current publication for later changes.