Monthly Returns in PineScript Strategies
A custom trading tool that generates monthly and yearly performance tables for trading strategies, helping traders analyze historical strategy performance and identify key periods of success or weakness.
Explore 11,183 indicators. Filter beyond the obvious.
Discover the tools that fit the way you trade.
11,183 tools to explore
A custom trading tool that generates monthly and yearly performance tables for trading strategies, helping traders analyze historical strategy performance and identify key periods of success or weakness.
A trading calendar indicator that displays daily and monthly market sentiment using three different sentiment calculation methods to help traders quickly assess market direction.
The Commitment of Traders (COT) report analyzes market positions of commercial, large, and small traders to provide strategic trading insights and market sentiment.
A multi-symbol scanner that tracks price movements against previous day, week, and month highs and lows, providing visual and alert-based tracking of key market levels.
A specialized price tracking indicator displaying previous day, week, and month's high and low price levels, adaptable across different timeframes to help traders identify key historical price reference points.
A tool that reveals seasonal price variations by calculating average price changes for specific days across multiple years, helping traders identify recurring market patterns.
A seasonality indicator that analyzes an asset's historical performance across daily, monthly, and quarterly timeframes, revealing patterns of market behavior throughout the year.
A visual time-tracking tool that plots vertical lines marking trading weeks and days to help traders maintain a clearer perspective on time-related aspects across different chart timeframes.
The Trapped Traders Order Blocks indicator identifies potential market reversals by detecting scenarios where large traders are caught in losing positions, signaling possible trend changes.
A comprehensive trading script that recreates TradingView's watchlist stats panel, offering real-time performance metrics and historical comparisons across multiple timeframes.
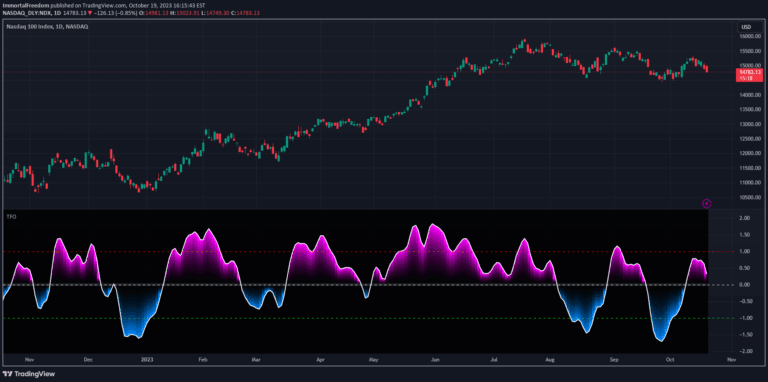
A novel trend oscillator developed by Dr. John Ehlers that provides near zero-lag averaging with consistent performance across multiple timeframes and candle durations.
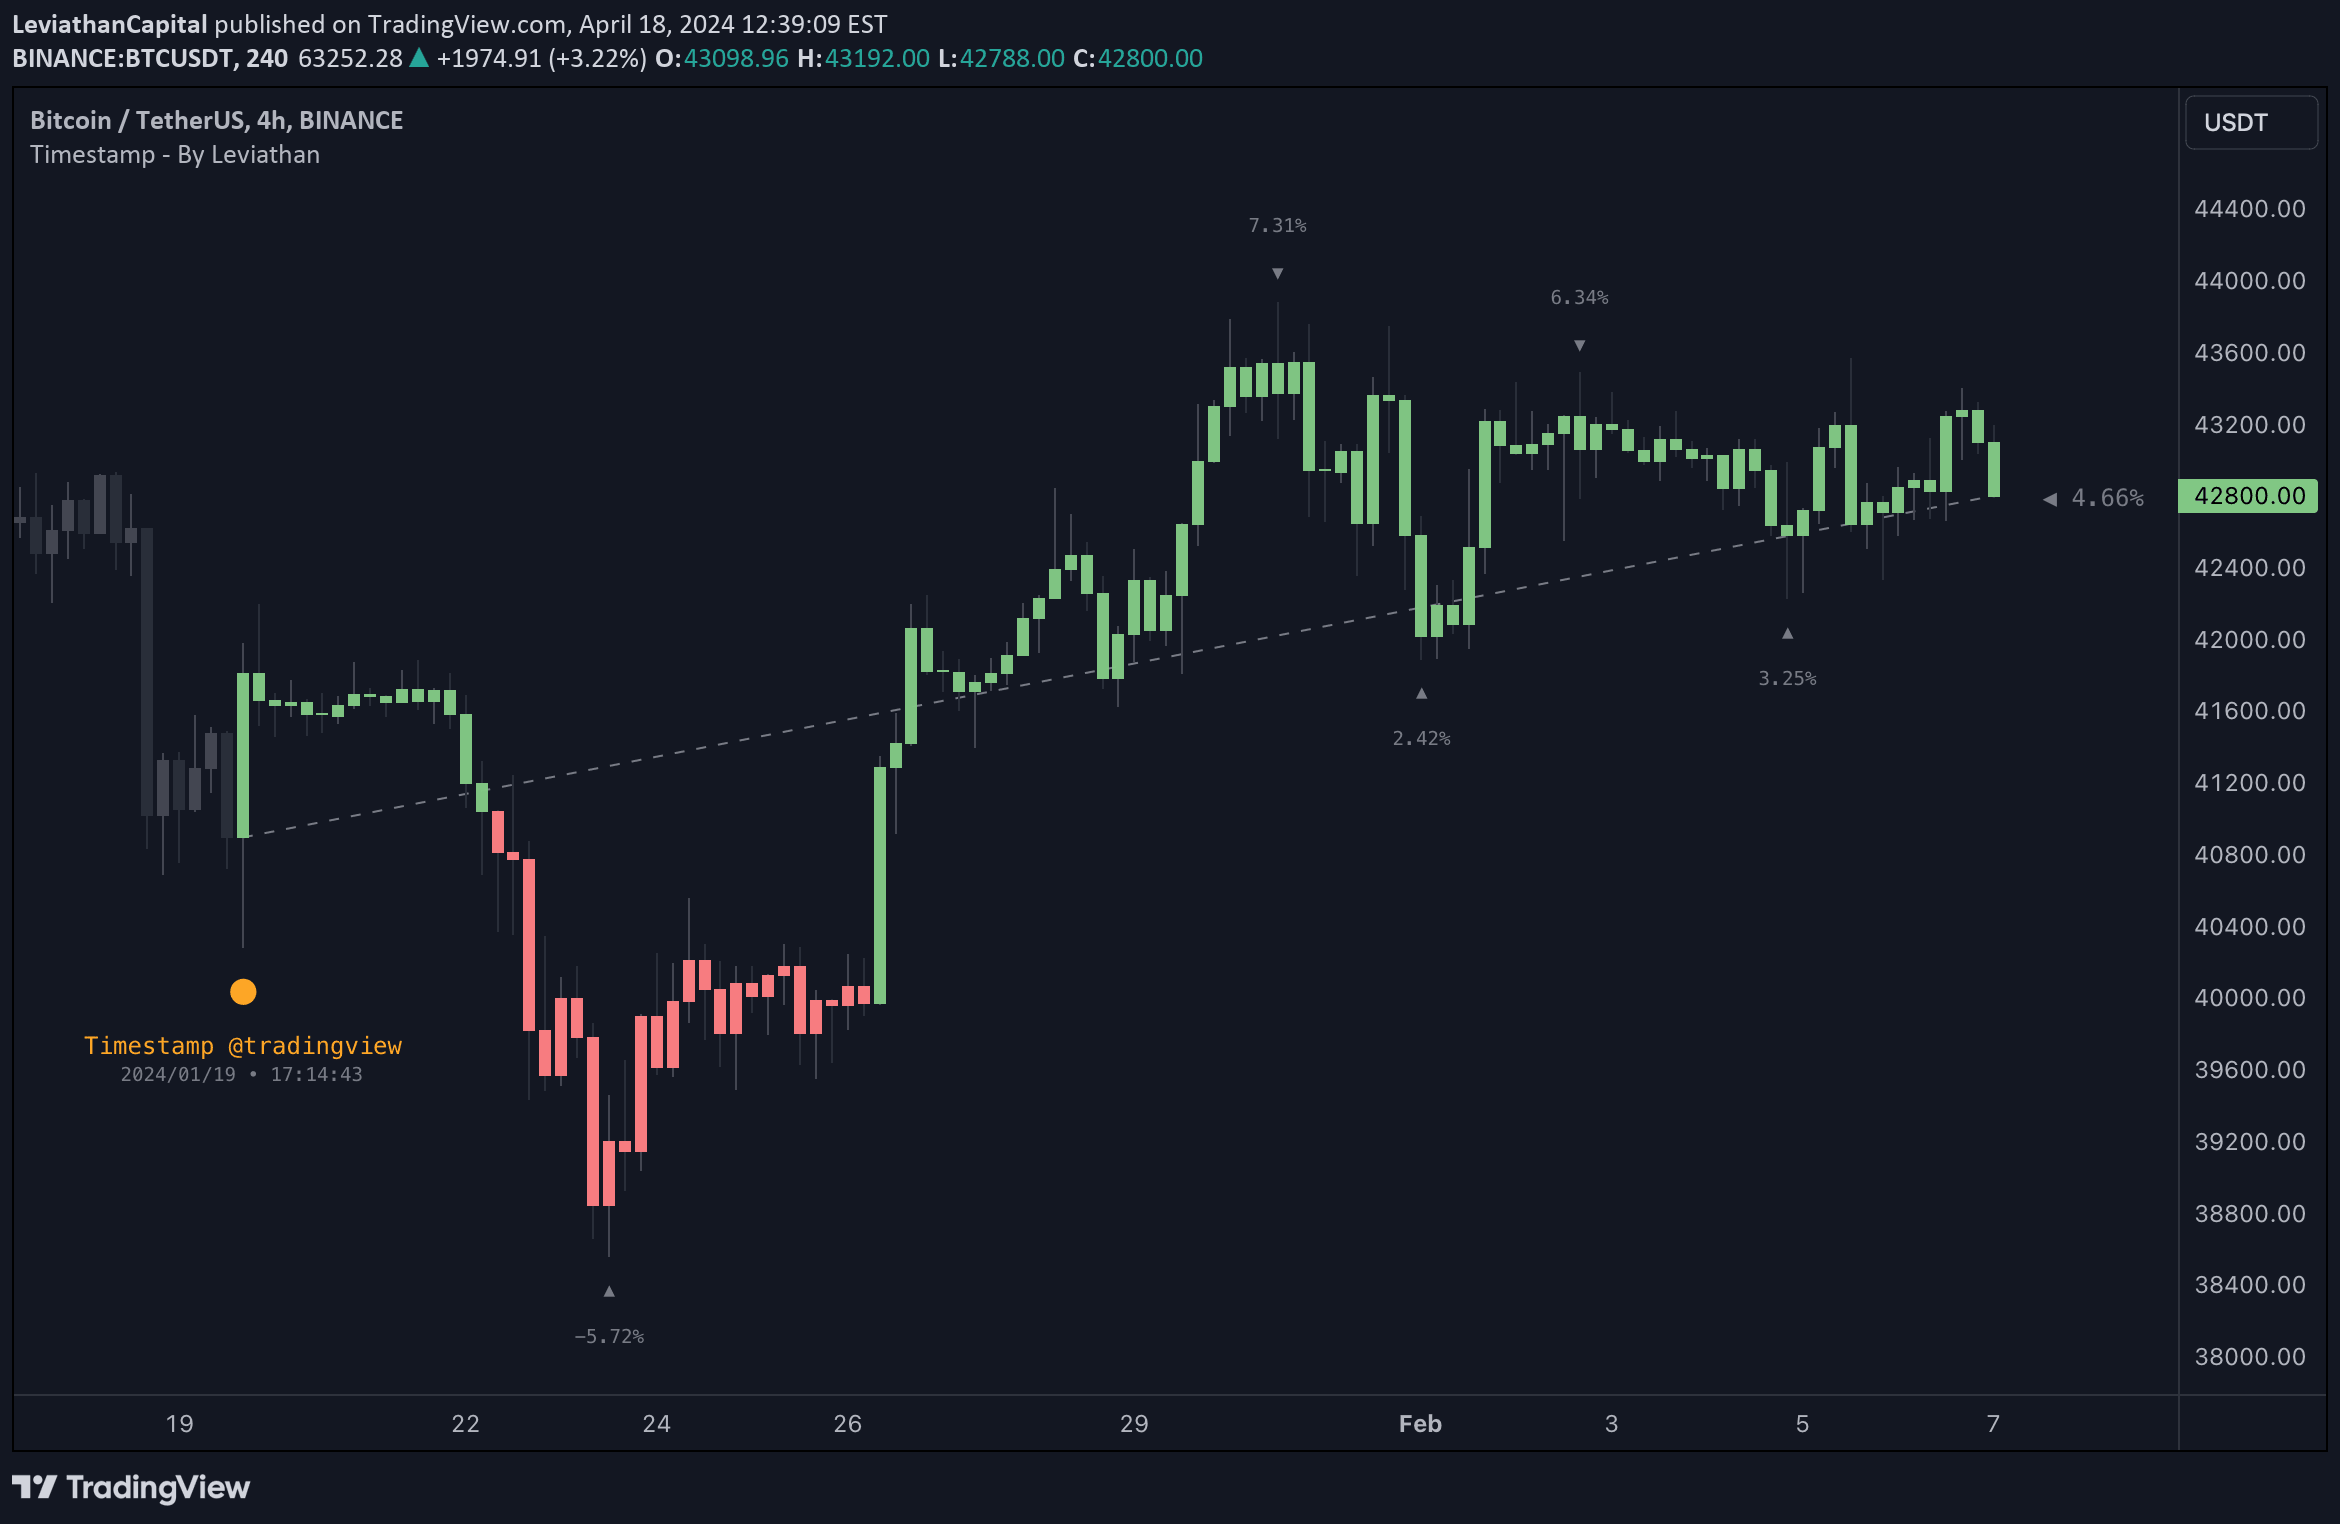
A tool for traders to generate visual timestamps of X/Twitter posts directly on trading charts, aligning social media content with market price actions and events.
Likes, views, and comments are historical TradingView snapshots. They describe attention, not trading performance.