Quarterly Earnings
A TradingView script that displays quarterly earnings per share and sales data with year-on-year percentage changes, offering customizable visualization of financial performance metrics.
Explore 11,183 indicators. Filter beyond the obvious.
Discover the tools that fit the way you trade.
11,183 tools to explore
A TradingView script that displays quarterly earnings per share and sales data with year-on-year percentage changes, offering customizable visualization of financial performance metrics.
A seasonality indicator that analyzes an asset's historical performance across daily, monthly, and quarterly timeframes, revealing patterns of market behavior throughout the year.
A financial analysis tool that compares quarterly, annual, and TTM performance metrics, providing comprehensive insights into company growth through various financial indicators and visualization options.
A trading approach that divides the day into quarters and 90-minute cycles, analyzing market phases of Accumulation, Manipulation, Distribution, and Rebalance.
AMDX strategy divides the trading day into four distinct phases, providing a structured approach to understanding market behavior and institutional trading patterns.
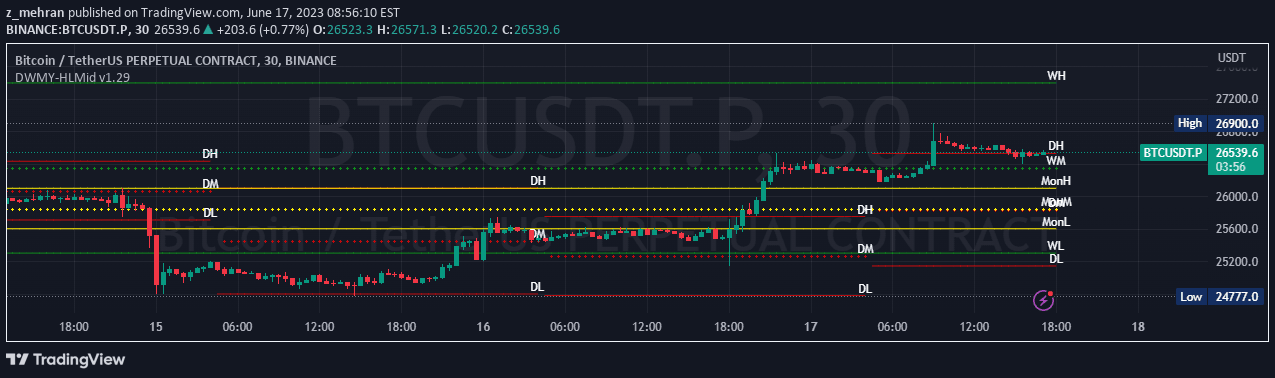
A comprehensive price level indicator that tracks daily, weekly, monthly, quarterly, and yearly high, mid, and low values to help traders analyze market movements and identify key support and resistance levels.
A dynamic trading system dividing market time into four quarterly phases, using fractal time analysis to identify optimal entry and exit points across different market conditions.
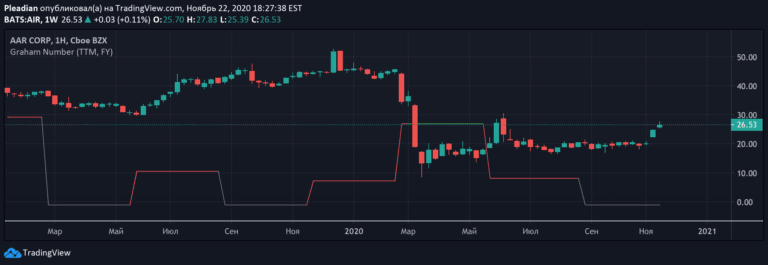
Graham Number is a stock valuation metric that calculates a stock's maximum fair market value by considering earnings per share and book value per share using a specific formula.
Sequential SMT Divergence is an advanced trading technique that identifies market manipulation and potential trend reversals by comparing correlated assets across quarterly time structures.
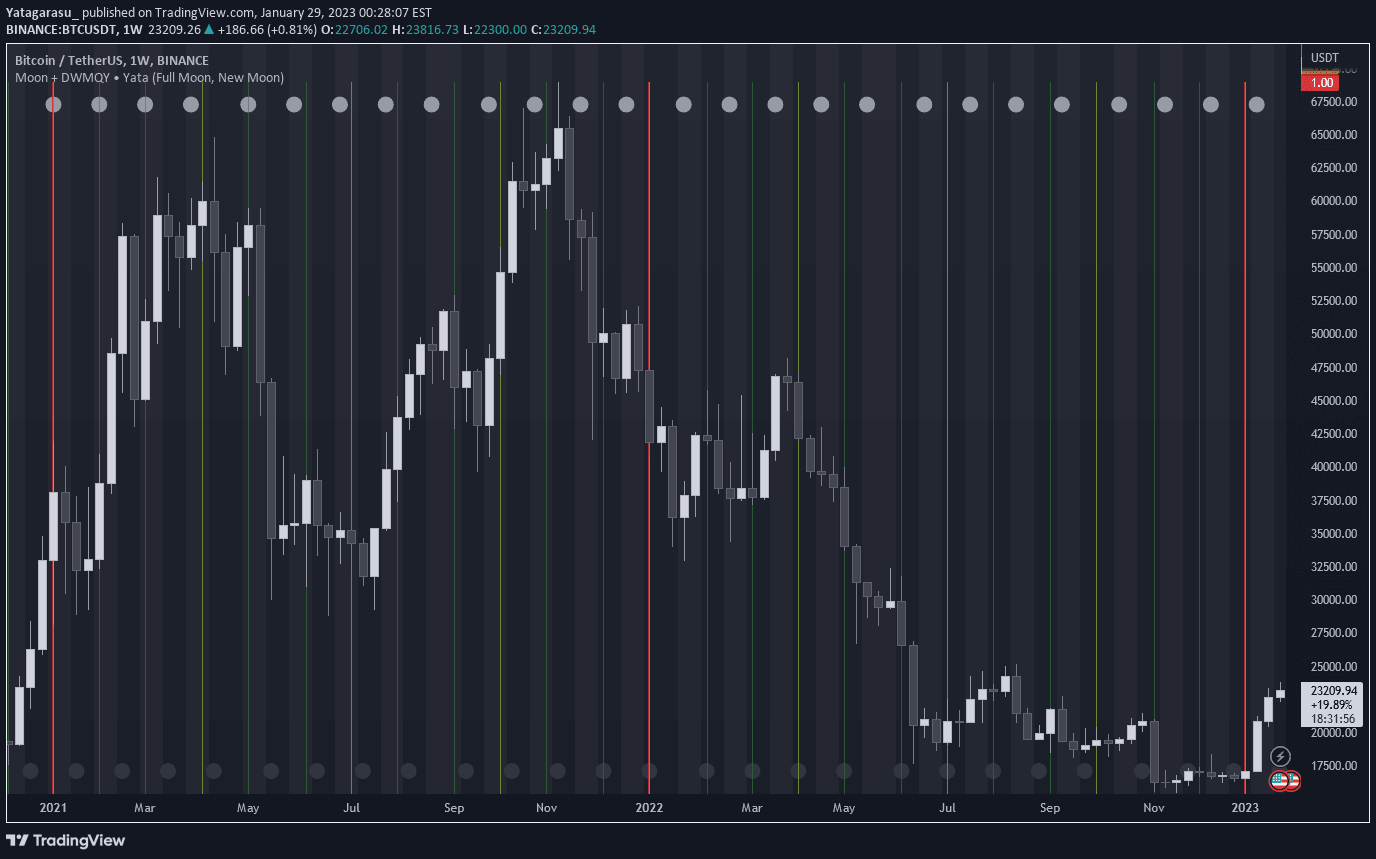
A trading strategy exploring potential correlations between moon phases and market movements, coupled with period break identification for market cycle analysis.
Analyzes stablecoin liquidity changes across different time intervals, revealing short-term and long-term fluctuations in market dynamics through percentage change calculations.
Doubling Theory reveals institutional market activity by analyzing time-based market structures, liquidity zones, and inter-asset divergences to identify high-probability trading opportunities.
Likes, views, and comments are historical TradingView snapshots. They describe attention, not trading performance.