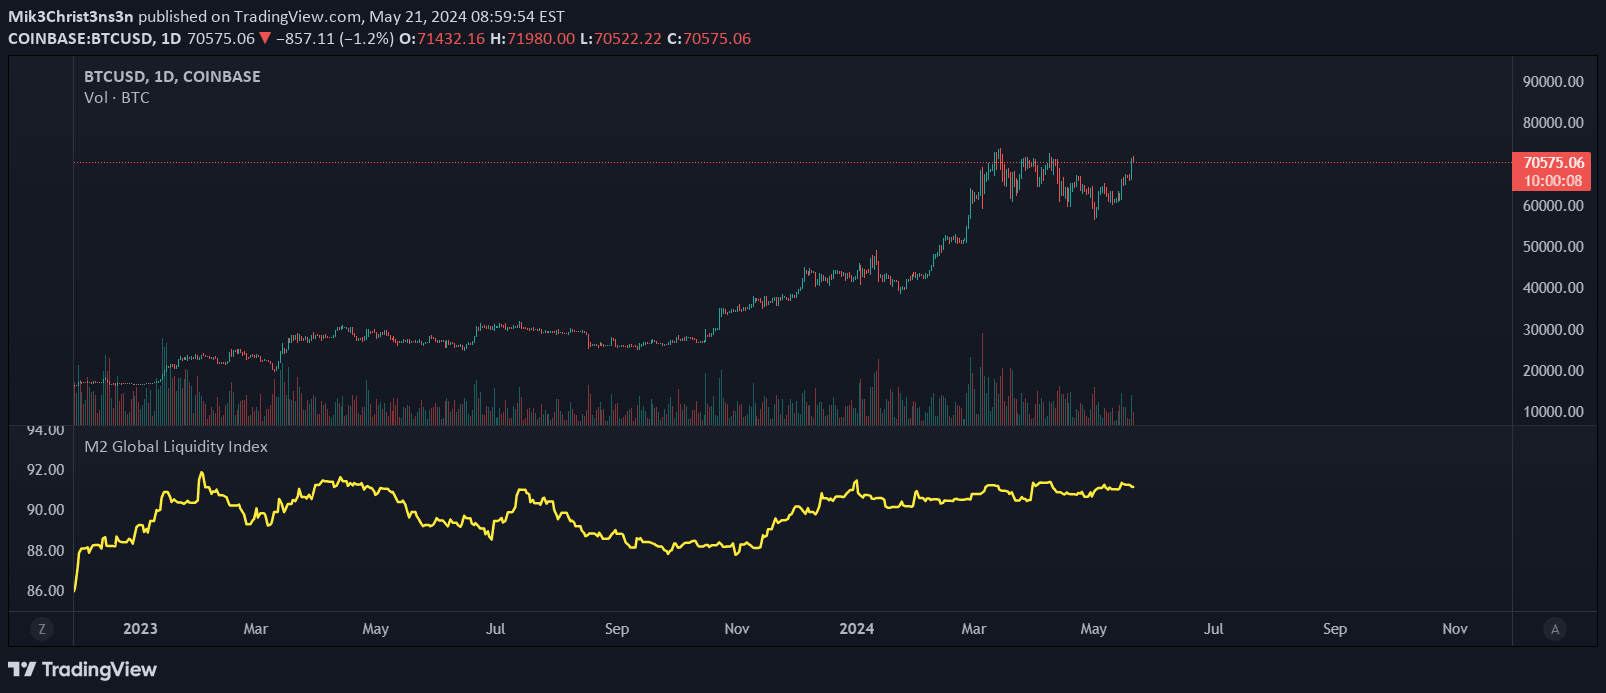
Analyzes stablecoin liquidity changes across different time intervals, revealing short-term and long-term fluctuations in market dynamics through percentage change calculations.
Explore complementary indicator rolesHow it works
The stablecoin liquidity percentage change calculation involves comparing current liquidity values with historical data at specific time intervals: week-on-week, month-on-month, quarter-on-quarter, and year-on-year. By computing these comparative percentages, the indicator tracks the rate of change in aggregate stablecoin liquidity across different timeframes.
Each percentage change is plotted with a distinct color, allowing traders to visually distinguish between short-term and long-term liquidity trends. The calculation involves subtracting the previous period's liquidity value from the current value, then dividing by the previous value and multiplying by 100 to express the change as a percentage.
Why it may be useful
Stablecoin liquidity percentage changes provide critical insights into market sentiment, capital flow, and potential trading opportunities across different timeframes. By revealing how liquidity evolves over various periods, traders can assess market dynamics, investor confidence, and potential trend shifts in the cryptocurrency ecosystem.
Understanding these liquidity changes helps traders make more informed decisions about market entry and exit points. The multi-interval analysis allows for a comprehensive view of market movements, enabling traders to differentiate between temporary fluctuations and more significant, sustained trends in stablecoin markets.
When to explore it
The stablecoin liquidity percentage change indicator is most effective during periods of market uncertainty or significant economic events that might impact cryptocurrency markets. Traders should pay close attention to this indicator when evaluating potential trend reversals, market sentiment shifts, or assessing overall market health.
It is particularly useful during times of increased market volatility, such as during regulatory announcements, major economic news, or significant blockchain ecosystem developments. Traders can leverage this indicator to validate other technical analysis tools and gain a more nuanced understanding of market dynamics across different time horizons.
Keep exploring
What we’ve verified
Access, alerts and repainting behaviour have not been independently verified for this indicator. Check the creator’s current publication and settings.
General descriptions and classifications are recovered research. Verified details above identify the specific checks we have completed. Check the creator’s current publication for later changes.