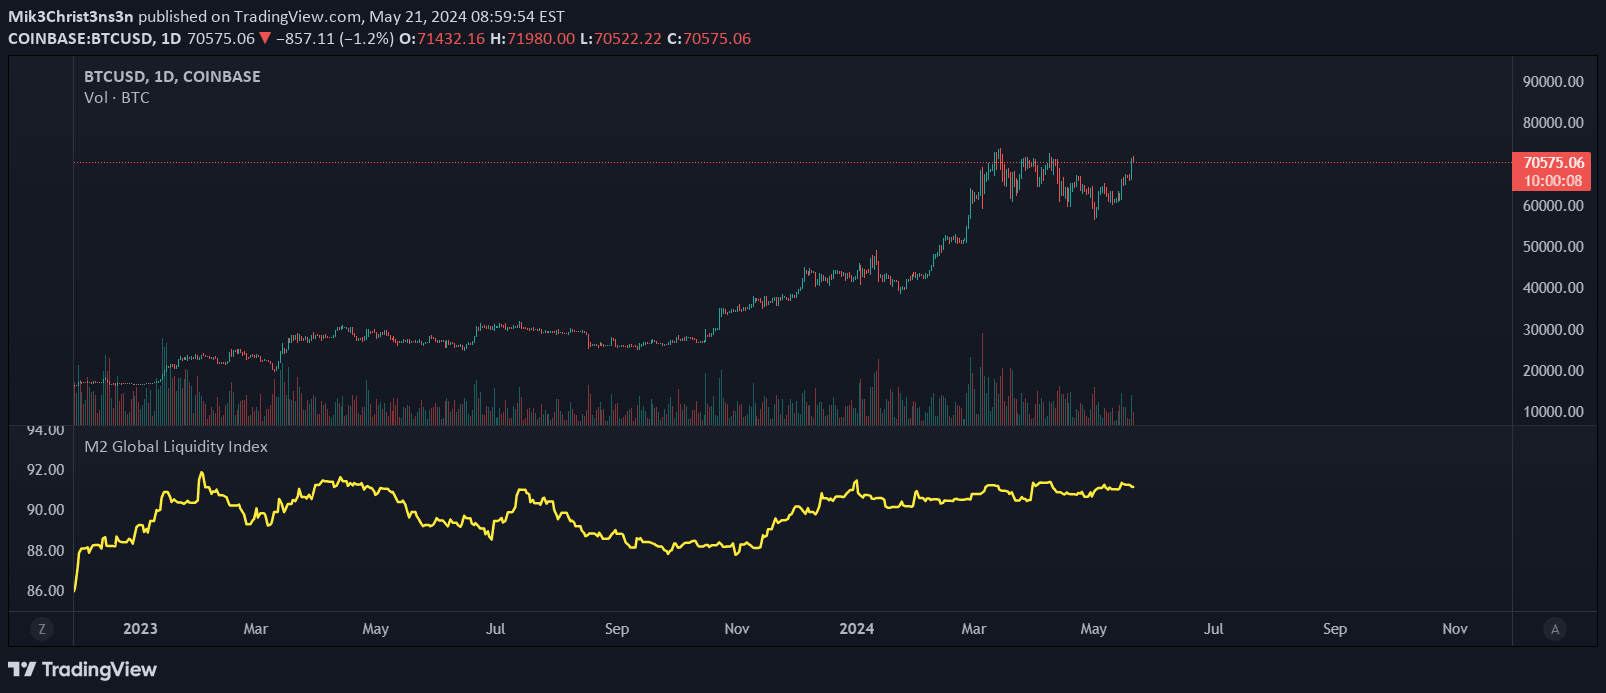
Analyzes total USD market liquidity using Federal Reserve and Treasury account balances to track potential market movements and risk asset correlations.
Explore complementary indicator rolesHow it works
The liquidity indicator calculates net market liquidity by combining data from three key sources: the Fed Balance Sheet, Reverse Repo Bids, and Treasury General Account Balance. It aggregates these financial metrics to create a comprehensive view of available market capital, tracking weekly changes in total USD liquidity.
The script generates signals by comparing current liquidity levels against a 7-day exponential moving average (EMA), providing visual indicators when liquidity moves above or below this baseline. This approach helps traders understand the broader economic context and potential market sentiment shifts.
Why it may be useful
Market liquidity is a critical indicator of economic health and potential asset performance, particularly for risk assets like cryptocurrencies. By tracking the total available capital in the financial system, traders can gain insights into potential market movements and underlying economic trends.
The indicator offers a macro perspective on market conditions, helping investors understand the broader economic environment that might influence asset prices. It provides a unique lens for analyzing market dynamics beyond traditional price-based indicators.
When to explore it
This liquidity indicator is most effective for swing trading and longer-term investment strategies, where macro economic trends play a significant role in asset performance. It works best when used on daily or weekly timeframes to capture broader market movements and economic shifts.
Traders should avoid using this indicator on very short timeframes, as its weekly data lag makes it less suitable for rapid trading decisions. It is most valuable when integrated with other fundamental and technical analysis tools to provide a comprehensive market assessment.
Keep exploring
What we’ve verified
Access, alerts and repainting behaviour have not been independently verified for this indicator. Check the creator’s current publication and settings.
General descriptions and classifications are recovered research. Verified details above identify the specific checks we have completed. Check the creator’s current publication for later changes.