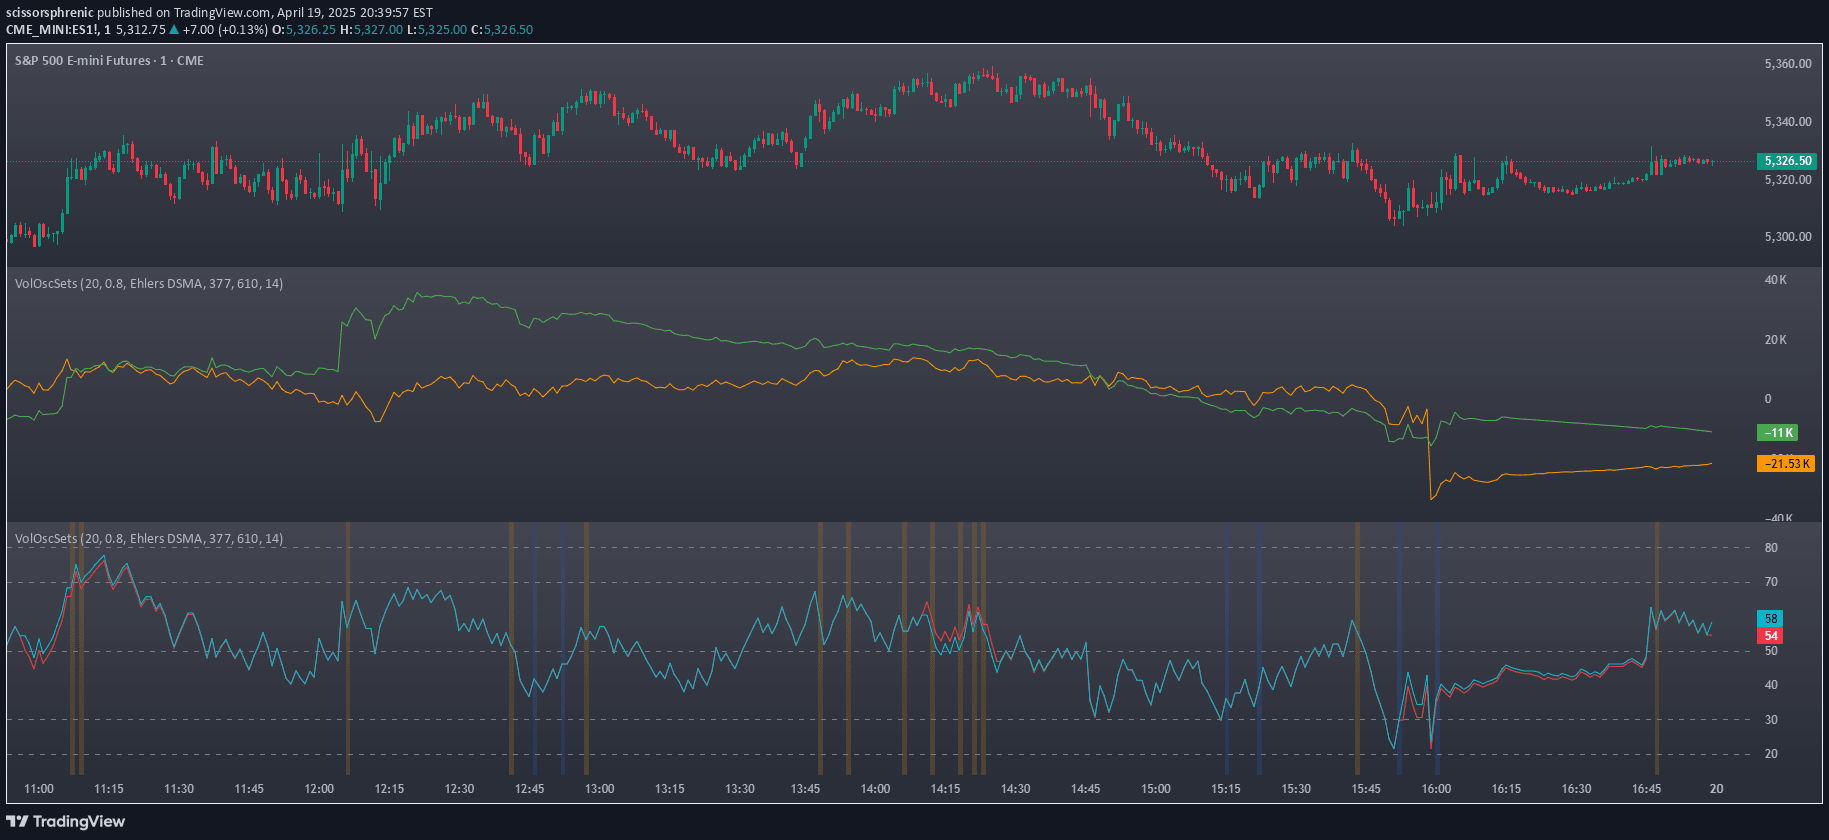
An overlay indicator tracking up/down volume breadth across NYSE and NASDAQ exchanges, providing insight into institutional buying pressure and market sentiment.
Explore complementary indicator rolesHow it works
The indicator calculates volume breadth ratios using specific volume data sources for NYSE and NASDAQ exchanges. It tracks the relationship between up volume and down volume, creating color-coded labels that update every 10 bars.
The ratios are computed using USI:UVOL and USI:DVOL for NYSE, and USI:UVOLQ and USI:DVOLQ for NASDAQ. Negative ratios are inverted to maintain a consistent X:1 format, ensuring clear and standardized representation of volume dynamics.
Why it may be useful
Volume breadth indicators provide crucial insights into market sentiment and institutional trading activity. They reveal whether buying or selling pressure is dominant across major exchanges, offering traders a deeper understanding of market dynamics beyond price movement.
By monitoring volume breadth, traders can confirm trend strength, identify potential reversals, and gauge the overall market conviction behind price movements. This helps in making more informed trading decisions by understanding the underlying market psychology.
When to explore it
This indicator is most effective during periods of market volatility and significant price movements. Traders can use it to confirm trend strength, identify potential trend reversals, and assess the overall market sentiment across major exchanges.
It is particularly useful when analyzing broad market trends, evaluating institutional trading activity, and seeking additional confirmation for trading strategies. The indicator can be applied across multiple timeframes, making it versatile for different trading styles and market conditions.
Keep exploring
What we’ve verified
Access, alerts and repainting behaviour have not been independently verified for this indicator. Check the creator’s current publication and settings.
General descriptions and classifications are recovered research. Verified details above identify the specific checks we have completed. Check the creator’s current publication for later changes.