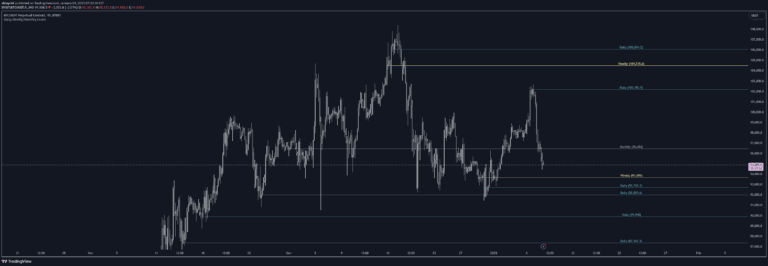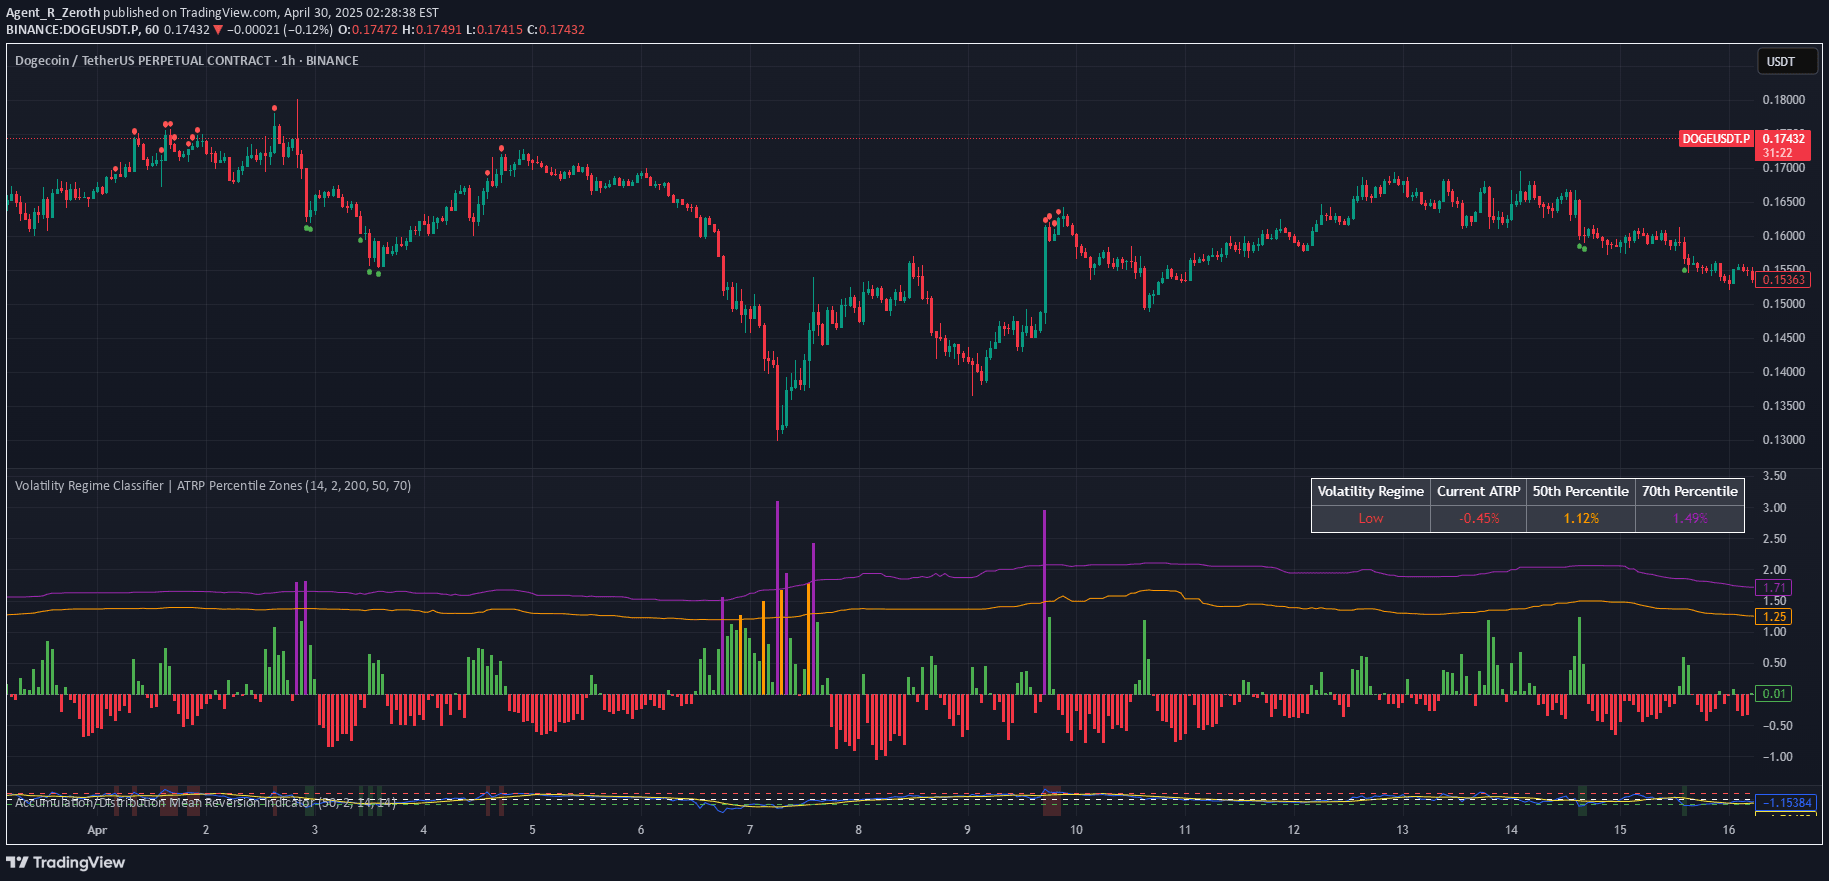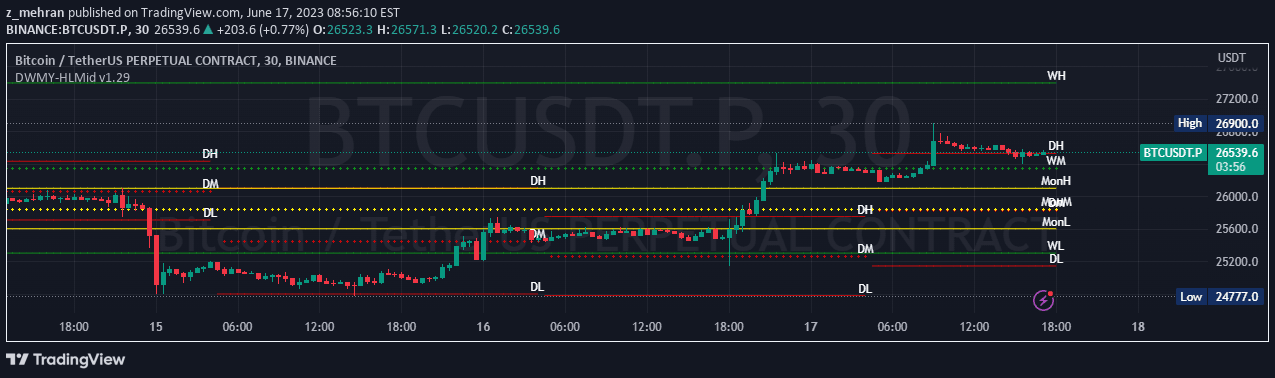
A comprehensive price level indicator that tracks daily, weekly, monthly, quarterly, and yearly high, mid, and low values to help traders analyze market movements and identify key support and resistance levels.
Explore complementary indicator rolesHow it works
The indicator calculates and displays multiple time frame price levels, including daily, Monday, weekly, monthly, quarterly, and yearly high, mid, and low values. It uses specific abbreviations like DH (Daily High), MH (Monthly High), and YL (Yearly Low) to represent these levels, providing traders with a comprehensive view of price movements across different time periods.
By plotting these levels on a chart, the indicator helps traders visualize price behavior and identify potential support and resistance zones. The levels are calculated using various methods, such as finding the highest and lowest prices for each time frame and determining midpoint values, which can help traders understand the market's price dynamics.
Why it may be useful
This indicator provides traders with a multi-dimensional view of price movements, helping them make more informed trading decisions by understanding how prices behave across different time frames. By displaying high, mid, and low values for various periods, traders can gain insights into market trends, potential reversal points, and key price levels that might influence future market movements.
The comprehensive nature of the indicator allows traders to see beyond short-term price fluctuations and understand the broader market context. This can be particularly useful for identifying long-term trends, support and resistance levels, and potential entry or exit points for trading strategies.
When to explore it
The indicator is most effective when traders want to analyze price movements across multiple time frames and gain a comprehensive understanding of market dynamics. It works best in markets with clear trends and when traders are looking to identify key support and resistance levels that extend beyond daily price action.
Traders can use this indicator during periods of market consolidation or when attempting to understand the broader market context. It is particularly useful for swing traders and investors who want to make more informed decisions based on a holistic view of price movements across different time periods.
Keep exploring
What we’ve verified
Access, alerts and repainting behaviour have not been independently verified for this indicator. Check the creator’s current publication and settings.
General descriptions and classifications are recovered research. Verified details above identify the specific checks we have completed. Check the creator’s current publication for later changes.