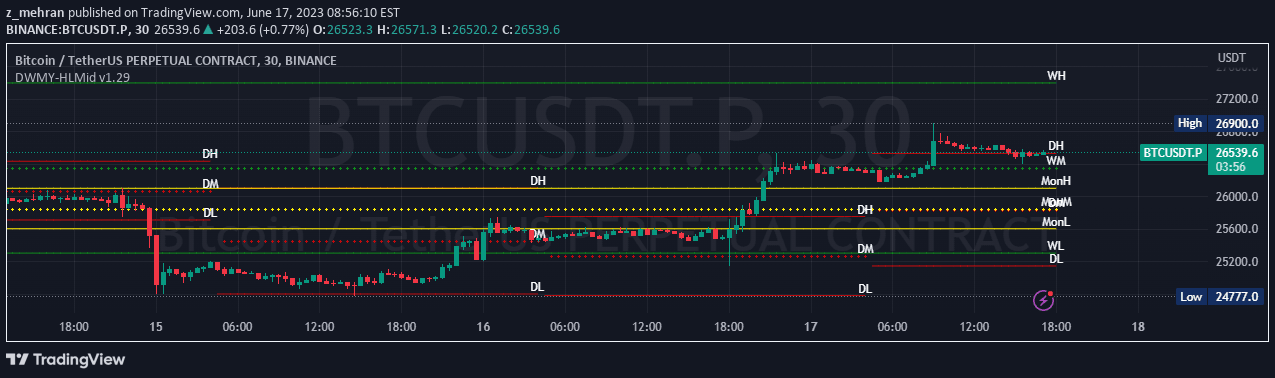
A comprehensive trading signal that tracks multiple price ranges across different market sessions, providing detailed insights into price movements with customizable alerts and visualization options.
Explore complementary indicator rolesHow it works
The trading signal operates by analyzing price movements across different time frames, including pre-market, daily, weekly, monthly, and yearly sessions. It uses a two-step incremental value system that allows traders to swap and compare different ranges, providing a dynamic view of price action.
By default, the signal shows two previous price points (Open, High, Low, Close) and can incrementally adjust to display different session ranges. This flexible approach enables traders to customize their view, track price movements, and identify potential trading opportunities across various market conditions.
Why it may be useful
This trading signal is crucial for traders seeking comprehensive market insights by offering a multi-dimensional view of price ranges and movements. It provides granular data across different time frames, helping traders understand market dynamics and potential trend shifts more effectively.
The signal's customizable nature allows traders to adapt their analysis to different market conditions, asset classes, and trading styles. By offering flexible alert settings, color-coding, and the ability to track multiple ranges simultaneously, it empowers traders to make more informed decisions and develop sophisticated trading strategies.
When to explore it
The trading signal is most effective during volatile market conditions where tracking multiple price ranges can provide a competitive edge. It works exceptionally well for traders monitoring different asset classes like stocks, futures, and cryptocurrencies, offering insights across various time frames.
Traders can leverage this signal during market transitions, such as pre-market and post-market sessions, or when analyzing longer-term trends across weekly, monthly, and yearly periods. Its versatility makes it particularly useful for identifying potential support and resistance levels, tracking price momentum, and developing precise entry and exit strategies.
Keep exploring
What we’ve verified
Access, alerts and repainting behaviour have not been independently verified for this indicator. Check the creator’s current publication and settings.
General descriptions and classifications are recovered research. Verified details above identify the specific checks we have completed. Check the creator’s current publication for later changes.