
YOUR INDICATOR RESEARCH STARTS HERE

Find the right indicator.
Understand what it does.

Explore 11,183 indicators. Filter beyond the obvious.
Discover the tools that fit the way you trade.

THE INDICATOR LIBRARY

Results for “premarket”

11,183 tools to explore

31 indicators matching your filters
Save search
VolumeEditor’s pick

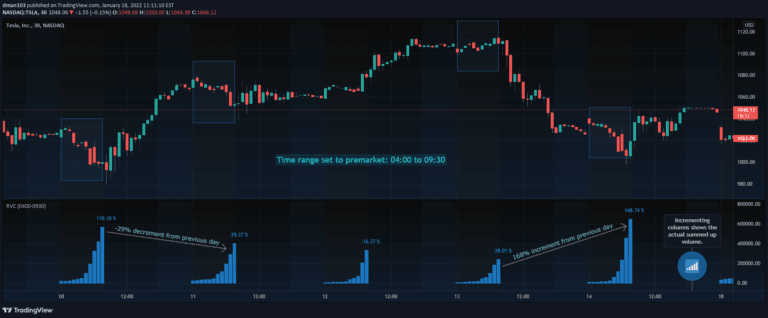
Range Volume Change

by dman103

Range Volume Change (RVC) is a custom trading indicator that tracks volume percentage changes within a specific time range, helping traders understand volume dynamics across different trading periods.

Separate pane · unverifiedDay Trading · Swing Trading
Explore
2.2Klikes92.6Kviews38comments
Save
VolumeEditor’s pick

Pre-Market Volume Profile

by Clansi

A pre-market volume indicator that highlights unusual trading activity, signaling potential high price movement by tracking volume deviations from the average.

Separate pane · unverifiedDay Trading
Explore
996likes50.4Kviews26comments
Save
LevelsSignal

Intraday Levels

by Mereep01

A day trading indicator that tracks and displays key price levels throughout the trading session, helping traders identify potential support and resistance zones.

Main price chart · unverifiedScalping · Day Trading
Explore
504likes6.6Kviews5comments
Save
LevelsSignal

Market Pivot Levels [Past & Live]

by serkany88

Market Levels signal provides daily pivot points tracking high, low, and close values across different market sessions using advanced polyline visualization techniques.

Main price chart · unverifiedScalping · Day Trading
Explore
207likes7.9Kviews0comments
Save
LevelsSignal

Previous and Premarket High/Low Indicator

by marcusgoll

A trading indicator that tracks and highlights the highest and lowest price levels during premarket and previous trading sessions, helping traders identify critical price points for strategic entry and exit.

Main price chart · unverifiedScalping · Day Trading
Explore
154likes3.8Kviews0comments
Save
TrendVolatility

Premarket Std Dev Bands

by PremiumAlgos

A premarket trading indicator that calculates standard deviation bands to analyze price volatility and potential market movements during early trading hours.

Main price chart · unverifiedScalping · Day Trading
Explore
111likes1.8Kviews2comments
Save
LevelsSignal

Intraday Fibs Retracement

by Mereep01

Fibonacci retracement tool that automatically draws support and resistance levels on charts, helping traders identify potential price reversal points during trading sessions.

Main price chart · unverifiedScalping · Day Trading
Explore
106likes1.6Kviews0comments
Save

Likes, views, and comments are historical TradingView snapshots. They describe attention, not trading performance.

START WITH A QUESTION

A little less searching.
A lot more understanding.

Tell DeepAlpha what you need. Get an explanation, a shortlist,
and a direct path to the indicators behind it.

Ask DeepAlpha