Range Volume Change (RVC) is a custom trading indicator that tracks volume percentage changes within a specific time range, helping traders understand volume dynamics across different trading periods.
Explore complementary indicator rolesHow it works
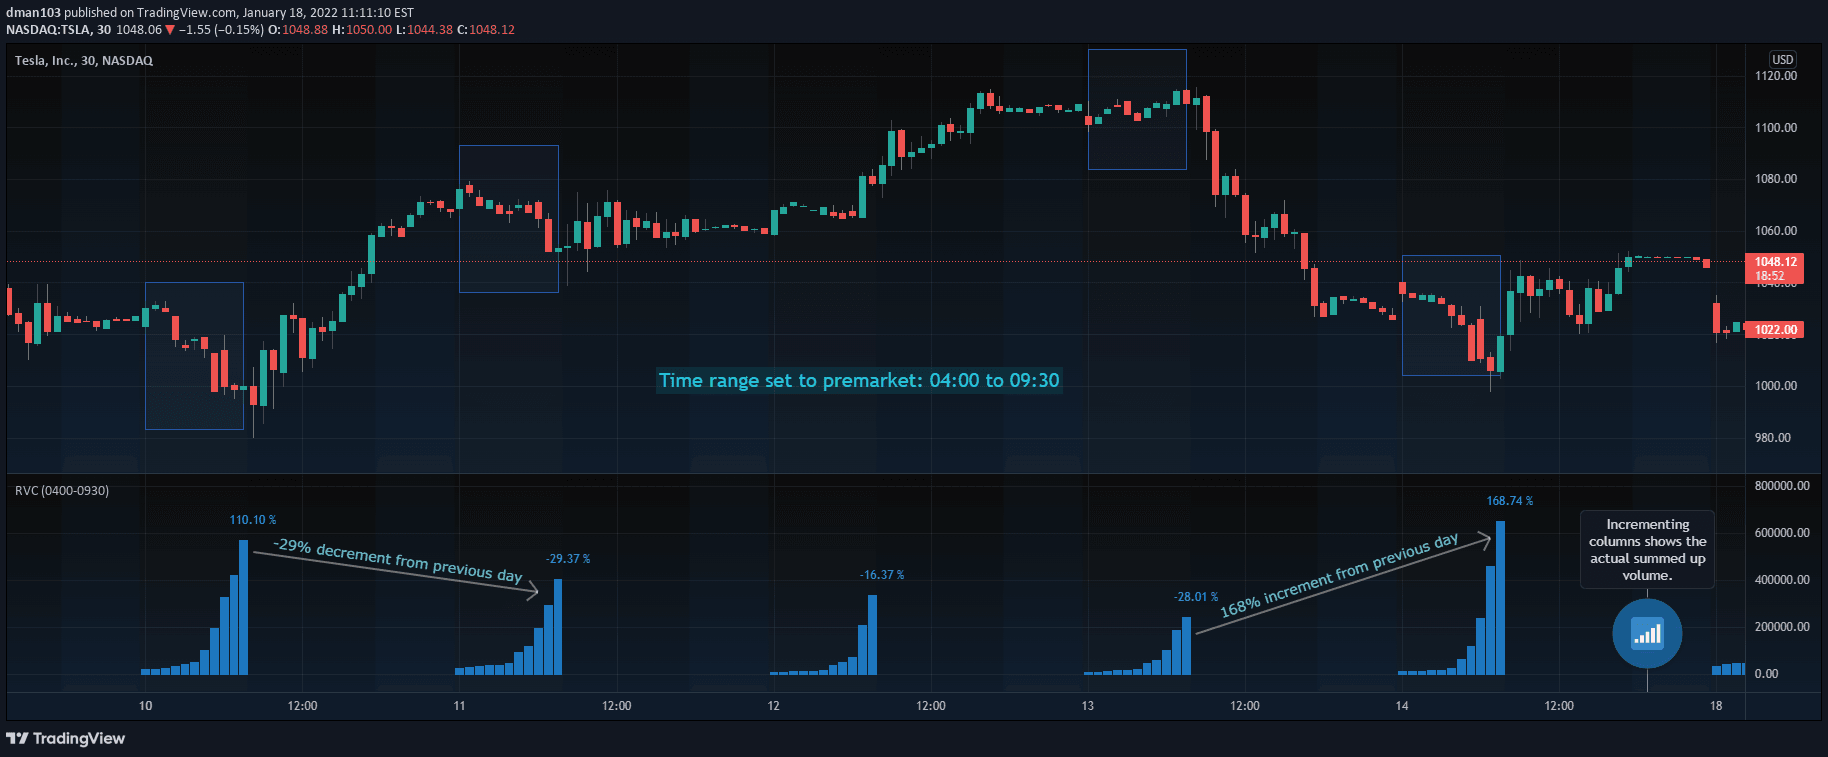
The Range Volume Change (RVC) indicator calculates the percentage difference in trading volume between a selected time range and the corresponding time range from the previous day. It tracks accumulated volume incrementally from the start of the specified time period.
The indicator visualizes volume changes using column sizes that increase with volume accumulation. RVC can be applied to various time ranges and works effectively with 24-hour assets like cryptocurrencies and forex. The indicator provides real-time data tracking and can optionally display volume percentage changes outside the primary time range
Why it may be useful
RVC is crucial for traders seeking to understand volume dynamics and potential market momentum shifts. By comparing current volume to previous day's volume, traders can identify potential trend strength or weakness. The incremental volume visualization helps traders quickly assess market activity and potential price movements.
This indicator provides insights into trading volume patterns that might not be immediately apparent through traditional volume indicators. Understanding volume changes can help traders make more informed decisions about market entry and exit points
When to explore it
RVC works best during active trading periods with significant market volatility. It is particularly useful for day traders and swing traders monitoring 24-hour markets like cryptocurrencies and forex. The indicator is most effective when analyzing volume trends during specific time ranges such as premarket, morning sessions, or other crucial trading windows.
Traders can leverage RVC to confirm trend strength, detect potential trend reversals, and assess market sentiment. It is especially valuable when combined with other technical indicators to provide a comprehensive market analysis
Keep exploring
What we’ve verified
Access, alerts and repainting behaviour have not been independently verified for this indicator. Check the creator’s current publication and settings.
General descriptions and classifications are recovered research. Verified details above identify the specific checks we have completed. Check the creator’s current publication for later changes.