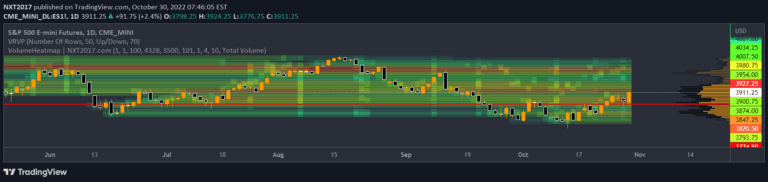
A volume heatmap indicator that calculates volume accumulation at specific price levels, helping traders identify high-volume support and resistance zones in the market.
Explore complementary indicator rolesHow it works
The volume heatmap indicator calculates volume accumulation similar to a volume profile by looking back and cumulating volume where the close price is in the same row area. Traders can manually choose how many rows the chart view displays, allowing for customizable analysis of volume distribution.
The indicator tracks and aggregates trading volume at specific price levels, creating a visual representation of where significant trading activity has occurred. By analyzing these volume concentrations, traders can identify key price levels with substantial market interest. The heatmap helps highlight areas where high volume might suggest potential support or resistance zones, providing insights into market dynamics and potential price interaction points.
Why it may be useful
Volume heatmap indicators are crucial for traders seeking to understand market sentiment and potential price movement dynamics. By revealing areas of significant trading activity, these indicators help traders identify key price levels where market participants have shown strong interest or commitment. This information can provide valuable insights into potential support and resistance zones, helping traders make more informed decisions about entry and exit points.
The visual representation of volume distribution allows traders to see beyond traditional price charts, offering a deeper understanding of market structure. By highlighting high-volume levels, traders can anticipate potential price reactions, validate trend strength, and develop more strategic trading approaches based on where market participants are most actively engaged.
When to explore it
The volume heatmap indicator is most effective in markets with consistent trading volume and clear price structures. It works particularly well in liquid markets such as major stock indices, forex pairs, and actively traded commodities where volume data provides meaningful insights. Traders can benefit from using this indicator during trending markets, range-bound conditions, and when seeking to confirm potential support or resistance levels.
This indicator is especially useful when combined with other technical analysis tools to validate trading signals. Traders should pay special attention to areas where high volume intersects with significant price levels, as these zones often represent potential turning points or continuation patterns. By integrating the volume heatmap with price action analysis, traders can develop more robust trading strategies across various timeframes and market conditions.
Keep exploring
What we’ve verified
Access, alerts and repainting behaviour have not been independently verified for this indicator. Check the creator’s current publication and settings.
General descriptions and classifications are recovered research. Verified details above identify the specific checks we have completed. Check the creator’s current publication for later changes.