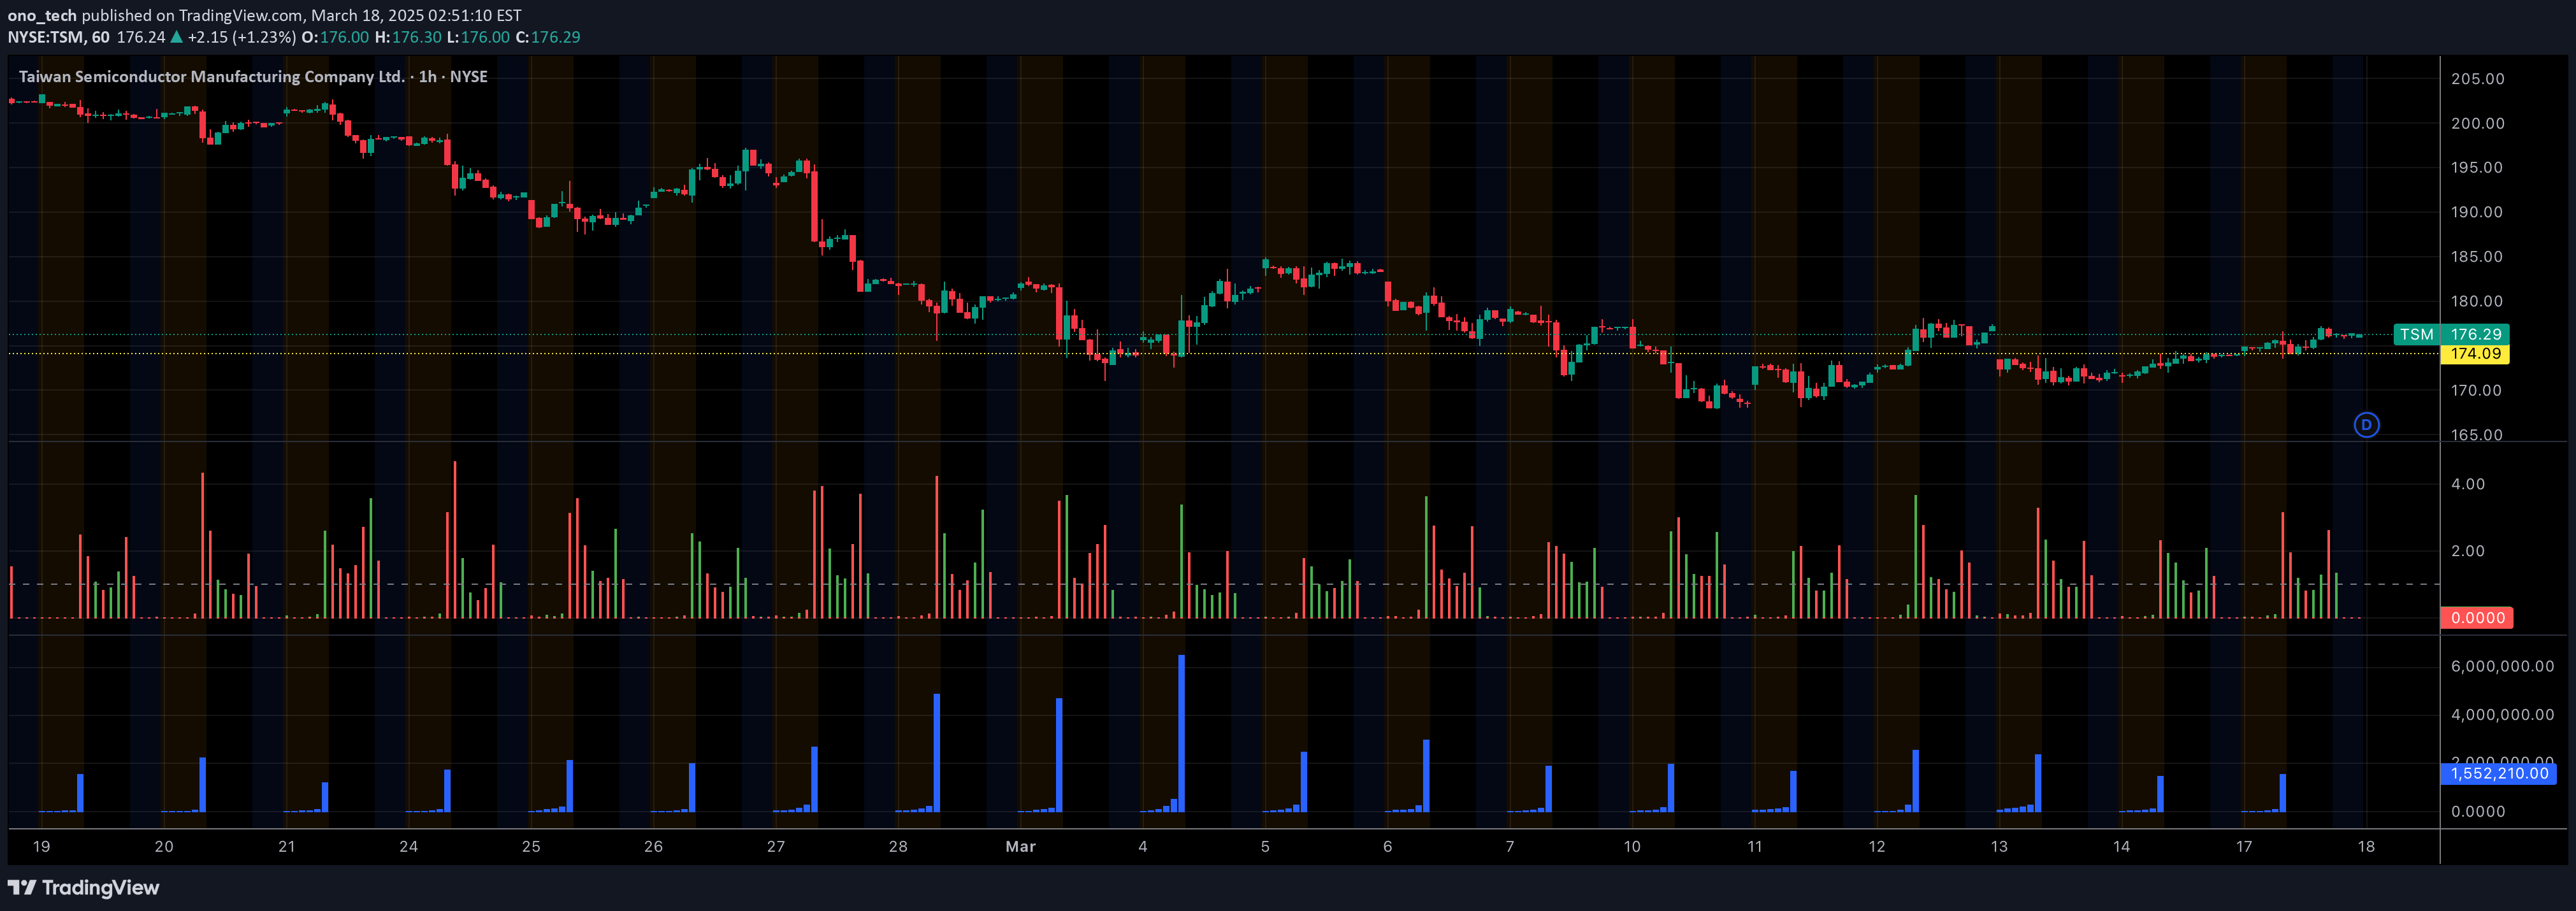
A pre-market volume indicator that highlights unusual trading activity, signaling potential high price movement by tracking volume deviations from the average.
Explore complementary indicator rolesHow it works
The pre-market volume indicator calculates the average pre-market volume using a Simple Moving Average (SMA) with a default length of 21 bars. It then compares the current pre-market volume against this average, using a multiplier of 2.5 to determine unusual volume.
When the current volume exceeds the average by the specified multiplier, it signals potential significant market movement. The indicator specifically focuses on pre-market trading volume, excluding post-market data from the previous day. Traders can customize the SMA length and multiplier to suit their specific trading strategy and sensitivity requirements
Why it may be useful
This indicator is crucial for traders seeking early insights into market sentiment and potential price shifts. By tracking unusual pre-market volume, it helps identify potential market maker activity and significant price movements before regular trading hours.
Institutional investors often create substantial market movements during pre-market trading, making this indicator valuable for detecting early trading opportunities. The customizable nature allows traders to adapt the indicator to different market conditions and personal risk tolerance. Understanding pre-market volume can provide a strategic advantage in making informed trading decisions
When to explore it
The pre-market volume indicator works best during periods of high market volatility and when analyzing stocks with significant institutional interest. It is particularly useful for day traders and active investors who want to gauge market sentiment before regular trading hours.
Traders should use this indicator in conjunction with other technical and fundamental analysis tools to confirm signals. It is most effective for stocks with consistent pre-market trading activity and when there are potential news events or earnings releases. The indicator can help traders identify potential gap openings and early trend reversals
Keep exploring
What we’ve verified
Access, alerts and repainting behaviour have not been independently verified for this indicator. Check the creator’s current publication and settings.
General descriptions and classifications are recovered research. Verified details above identify the specific checks we have completed. Check the creator’s current publication for later changes.