Quarterly Earnings
A TradingView script that displays quarterly earnings per share and sales data with year-on-year percentage changes, offering customizable visualization of financial performance metrics.
Explore 11,183 indicators. Filter beyond the obvious.
Discover the tools that fit the way you trade.
11,183 tools to explore
A TradingView script that displays quarterly earnings per share and sales data with year-on-year percentage changes, offering customizable visualization of financial performance metrics.
A custom trading tool that generates monthly and yearly performance tables for trading strategies, helping traders analyze historical strategy performance and identify key periods of success or weakness.
A trading indicator that highlights previous market highs and lows, creating customizable support and resistance zones across multiple timeframes to help traders identify potential price reaction levels.
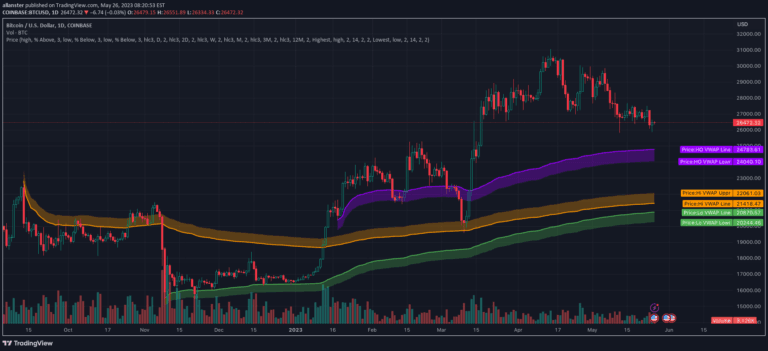
A Volume Weighted Average Price (VWAP) tool that plots VWAP close levels across multiple timeframes, helping traders identify key support and resistance levels.
A market analysis tool that calculates probabilities of price tops and bottoms across various time periods, offering traders strategic insights into market timing and potential trend reversals.
An advanced VWAP toolbox that provides multiple anchored VWAP techniques, including pinch and handoff strategies, periodic intervals, and automatic anchor selection for technical analysis.
A dynamic market overview tool that tracks percentage changes across multiple indices or sectors, allowing traders to quickly assess performance and trends across different timeframes.
A polar chart tool that visualizes cryptocurrency dominance by combining traded dollar volume and volatility across multiple timeframes for easy comparative analysis.
The Anchored Powered KAMA is an advanced adaptive moving average that uses multiple anchor periods and a power exponent to filter market trends and volatility more effectively.
A multi-timeframe support and resistance indicator that helps traders identify critical price levels across daily, weekly, monthly, quarterly, and yearly timeframes.
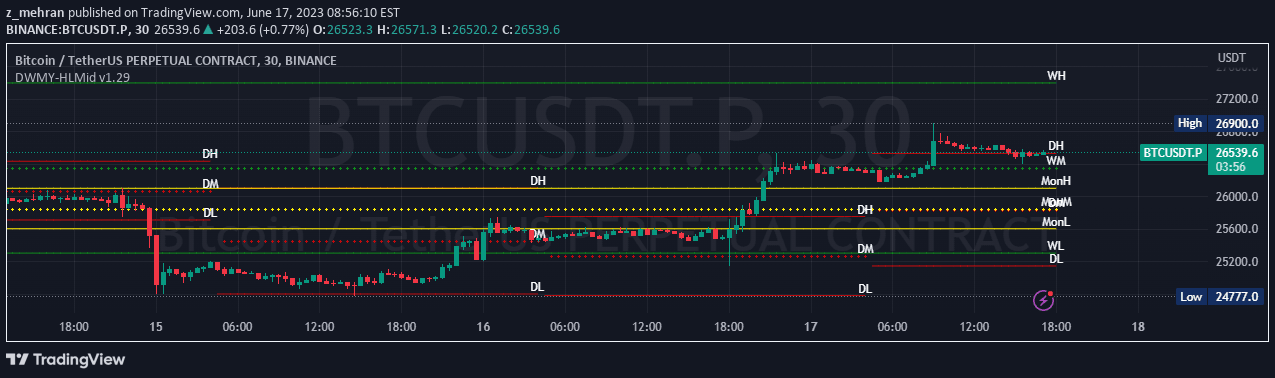
A comprehensive price level indicator that tracks daily, weekly, monthly, quarterly, and yearly high, mid, and low values to help traders analyze market movements and identify key support and resistance levels.
A comprehensive dividend tracking tool that helps investors analyze dividend payouts, forecast income, and make strategic investment decisions across various stocks and sectors.
Likes, views, and comments are historical TradingView snapshots. They describe attention, not trading performance.